
Your win rate fell, and every team already knows the reason. The trouble is that each team knows a different one:
Each story comes with a report that seems to prove it. One poster on Reddit, writing after a 20% drop, had three answers and no way to choose: “Gartner says we’re gaining share, sales says we’re losing on price and the three buyer interviews I’ve managed to get done say it’s our onboarding experience.”
In your own list, two of the three stories are claims about a rival: that someone quoted less, or showed something you can’t. Your CRM records that you lost, and to whom. It doesn’t record what the rival said to win.
Mystery Demo finds out that part. Its team books competitors’ real sales demos as a credible buyer and brings back the recording of what each rep quotes, shows and promises. Here is a diagnosis a sales leader and an enablement lead can run together, in order: test each story in your own data this week, find out what a rival now tells buyers if the losses point at one, then weigh every story against its evidence.
Step 1: Test Each Story in Your Own Data
The diagnosis ends on one sheet, with a row for each team’s story: the evidence for it, the evidence against it, a verdict and the next step. Here is one filled in for an invented company and an invented rival.
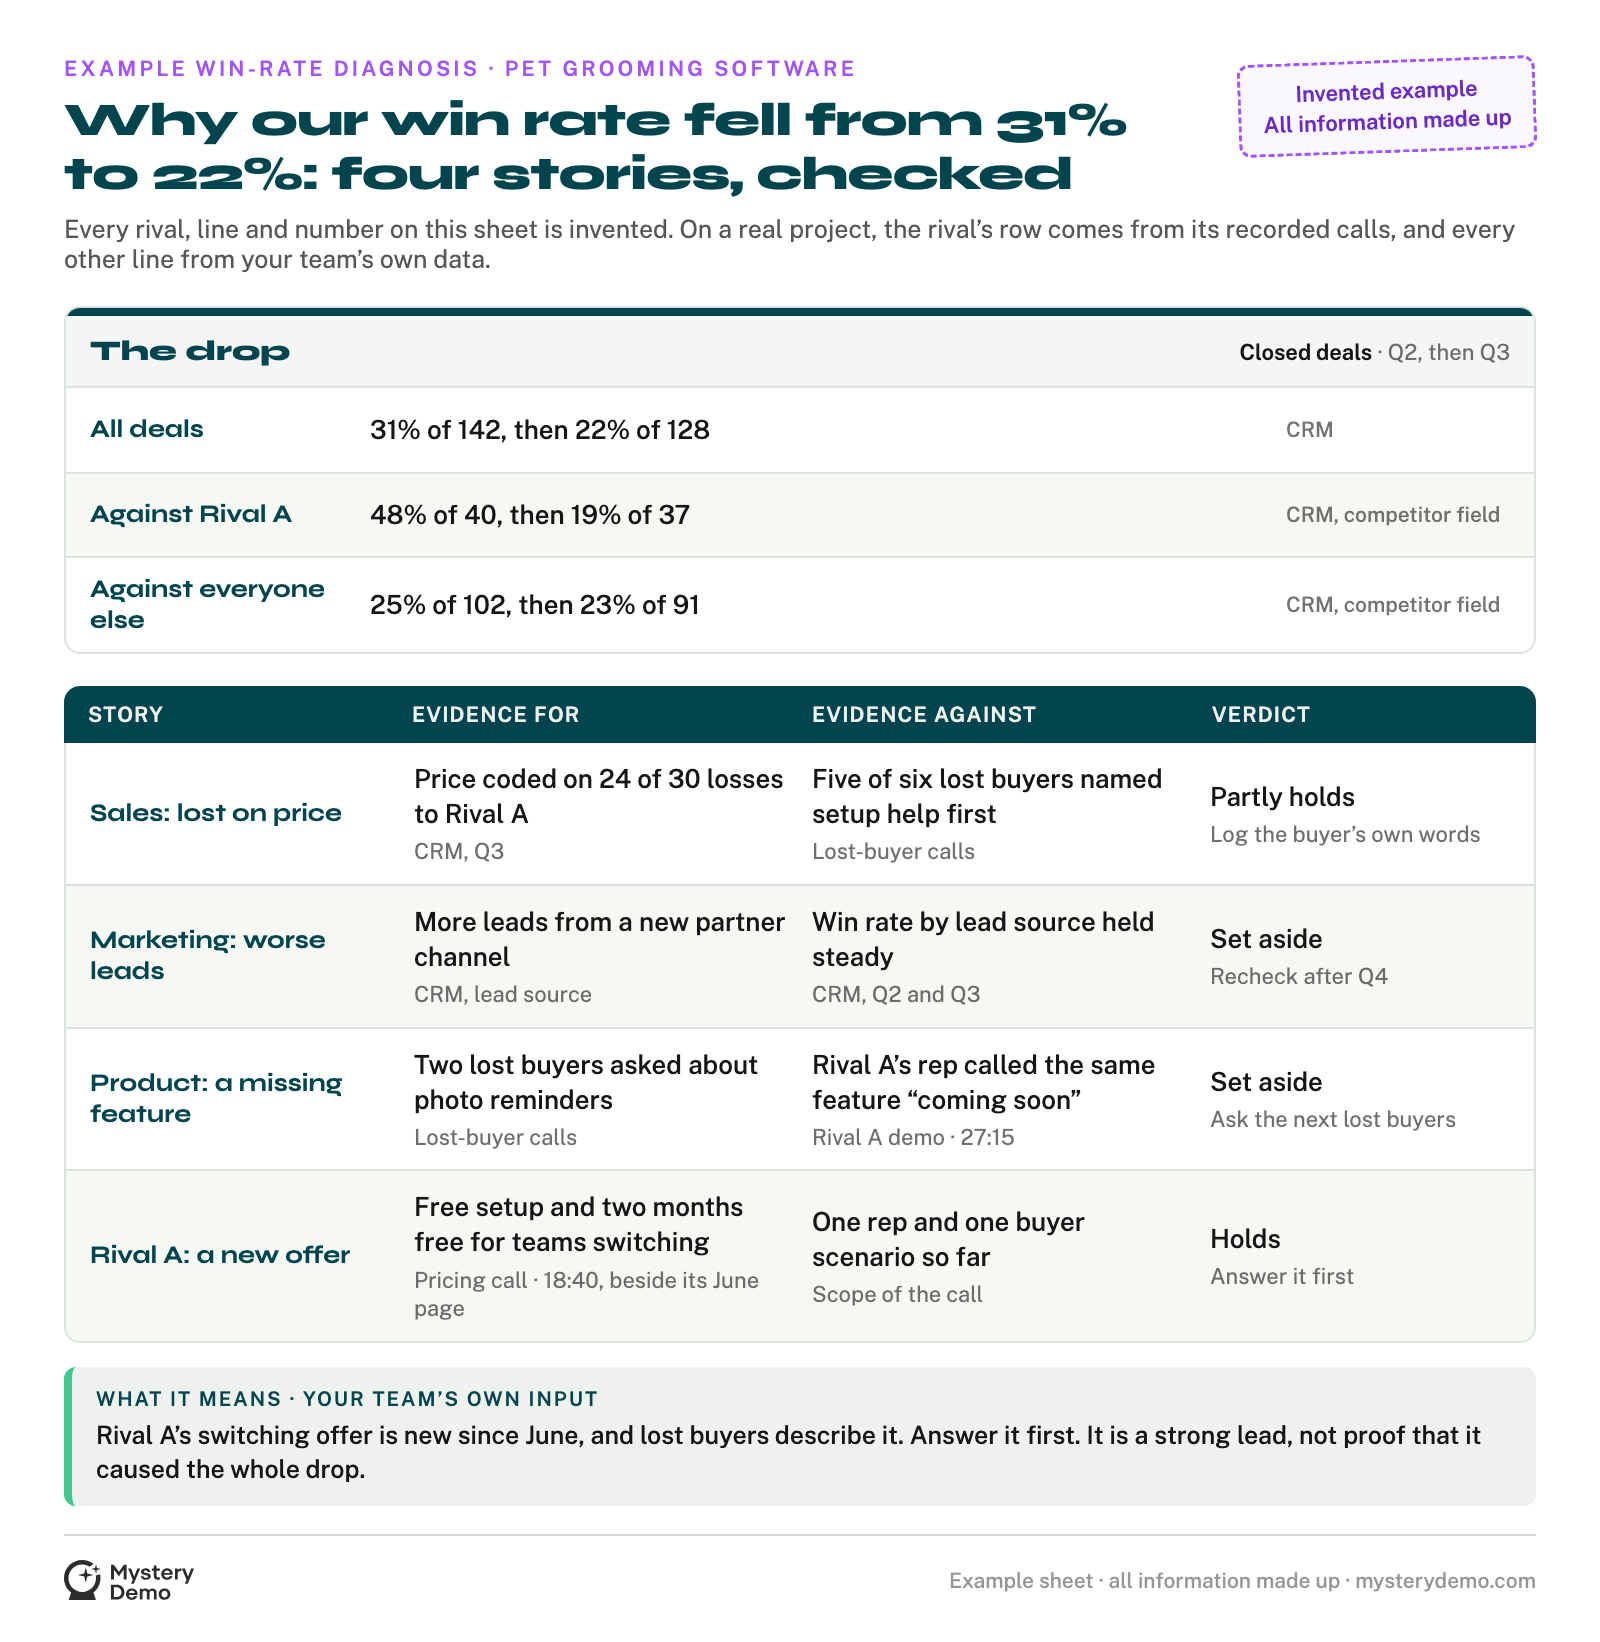
On this invented sheet, the drop sits almost entirely in deals against Rival A. The leads story and the missing feature were set aside, and price held in part. The rival’s new offer held: its rep made it on a recorded pricing call, and the rival’s pricing page from June carried no such offer.
Your own sheet starts with two periods: the quarter before the drop and the quarter since. Use the same definitions in both, for what counts as an opportunity and what counts as a win, and put the deal count next to every rate. A rate built on a dozen deals can swing on two of them.
| The question | Where to look in your own data | What the answer supports, and what it leaves open |
|---|---|---|
| Did the mix of deals change? | Win rate by segment, deal size, lead source and any new market, in both periods | If each segment held steady and only the mix moved, the drop is mostly mix. A selling problem inside one segment is still possible. |
| Did you change something yourself? | The dates of your own changes: when a deal enters the pipeline, stage rules, your pricing and packaging | A change dated just before the drop is a strong suspect. Logging deals earlier, for one, lowers the measured win rate with no change in how anyone sells. |
| What do lost buyers say? | Closed-lost reasons, then a handful of calls with lost buyers | It shows whether “price” meant the number, or something behind it such as setup or switching. A few calls point the way; they don’t settle a pattern. |
| Is the drop mostly against one rival? | Win rate and losses by the competitor named on each deal, with the counts | A drop against one rival points at it. Losses spread across rivals still leave them open, because the competitor field is only as full as your reps keep it. |
| What changed at that rival? | Not in your CRM. Lost buyers may mention it secondhand. | The question Step 2 answers |
The third row needs the most care, because “lost on price” is the easiest of the closed-lost reasons to log. Salesloft, which sells sales engagement software, surveyed 500 US sales and revenue decision-makers for its 2026 benchmark. Of those, 84% said loss reasons are captured often or always, yet 55.6% said what goes into the CRM is based mostly on subjective seller reporting.
So ask lost buyers to walk you through their decision, in their own words. That is how the poster on Reddit heard “onboarding” from three buyer interviews while sales was saying “price.” As one reply on the thread said, “‘lost on price’ is usually the rep’s summary, not the buyer’s sentence.”
The fourth row has a rule of thumb from a revenue leader on LinkedIn: “If you’re losing deals you always won, that’s competitor or product.” By the end of the week, the table points one of three ways:
The last row of the table is the one your data can’t reach. You know which rival won the deal. You don’t know what it said to win it.
Step 2: Find Out What the Rival Now Tells Buyers
When the losses sit against one rival, something on its side may be new: a lower price, a new pitch, or an offer aimed at your customers. None of it shows up in your CRM, because it is said in that rival’s sales calls. Every other source catches part of it, and stops somewhere:
| Source | What it shows | Where it stops |
|---|---|---|
| The rival’s website and pricing page | The price and the pitch it publishes for everyone | The quote a buyer like yours hears, which comes later, on a call |
| Review sites and tracking tools | What the rival wants buyers to believe, collected in one place | What its reps say once a buyer is in the room |
| What your own reps report | The rival’s pitch, as a buyer retold it | The exact words, the number and when it was said |
| Lost buyers | What they remember of the rival’s offer | Whatever they didn’t notice, or would rather not share |
| A recorded run through the rival’s sales process | What its rep quotes, pitches and offers a buyer like yours, now | One rep and one kind of buyer; showing a change needs dated evidence from before |
Mystery Demo runs that last row for you. Its team goes through the rival’s sales process as a buyer. Before the first call, it writes a buying scenario that fits the deals you are losing: the kind of company, the problem it needs solved, and its timeline.
Then the team requests the demo through the rival’s normal front door, like any serious prospect, and the rival runs its usual process:
Every call is recorded, and every email and quote is kept. Afterwards the team checks each claim the rep made against the rival’s website, LinkedIn and public news, then writes the analysis.
Your own team can’t take that seat. A rep from your company gets recognized, or gets the generic tour. The demos are run by operators who have sold B2B software themselves, so they know which question pulls a rep off the script.
One competitor takes one to two weeks and costs a flat €499, everything included. Start it the day your data points at one rival, so the rival’s row fills soon after your own tests finish.


Everything lands on a Notion board, the client’s shared workspace, with a page for each rival built from its calls. Below is the analysis on one rival’s page from our public example board, where the client and every competitor are invented. A real board is built from the calls Mystery Demo takes with that client’s competitors.
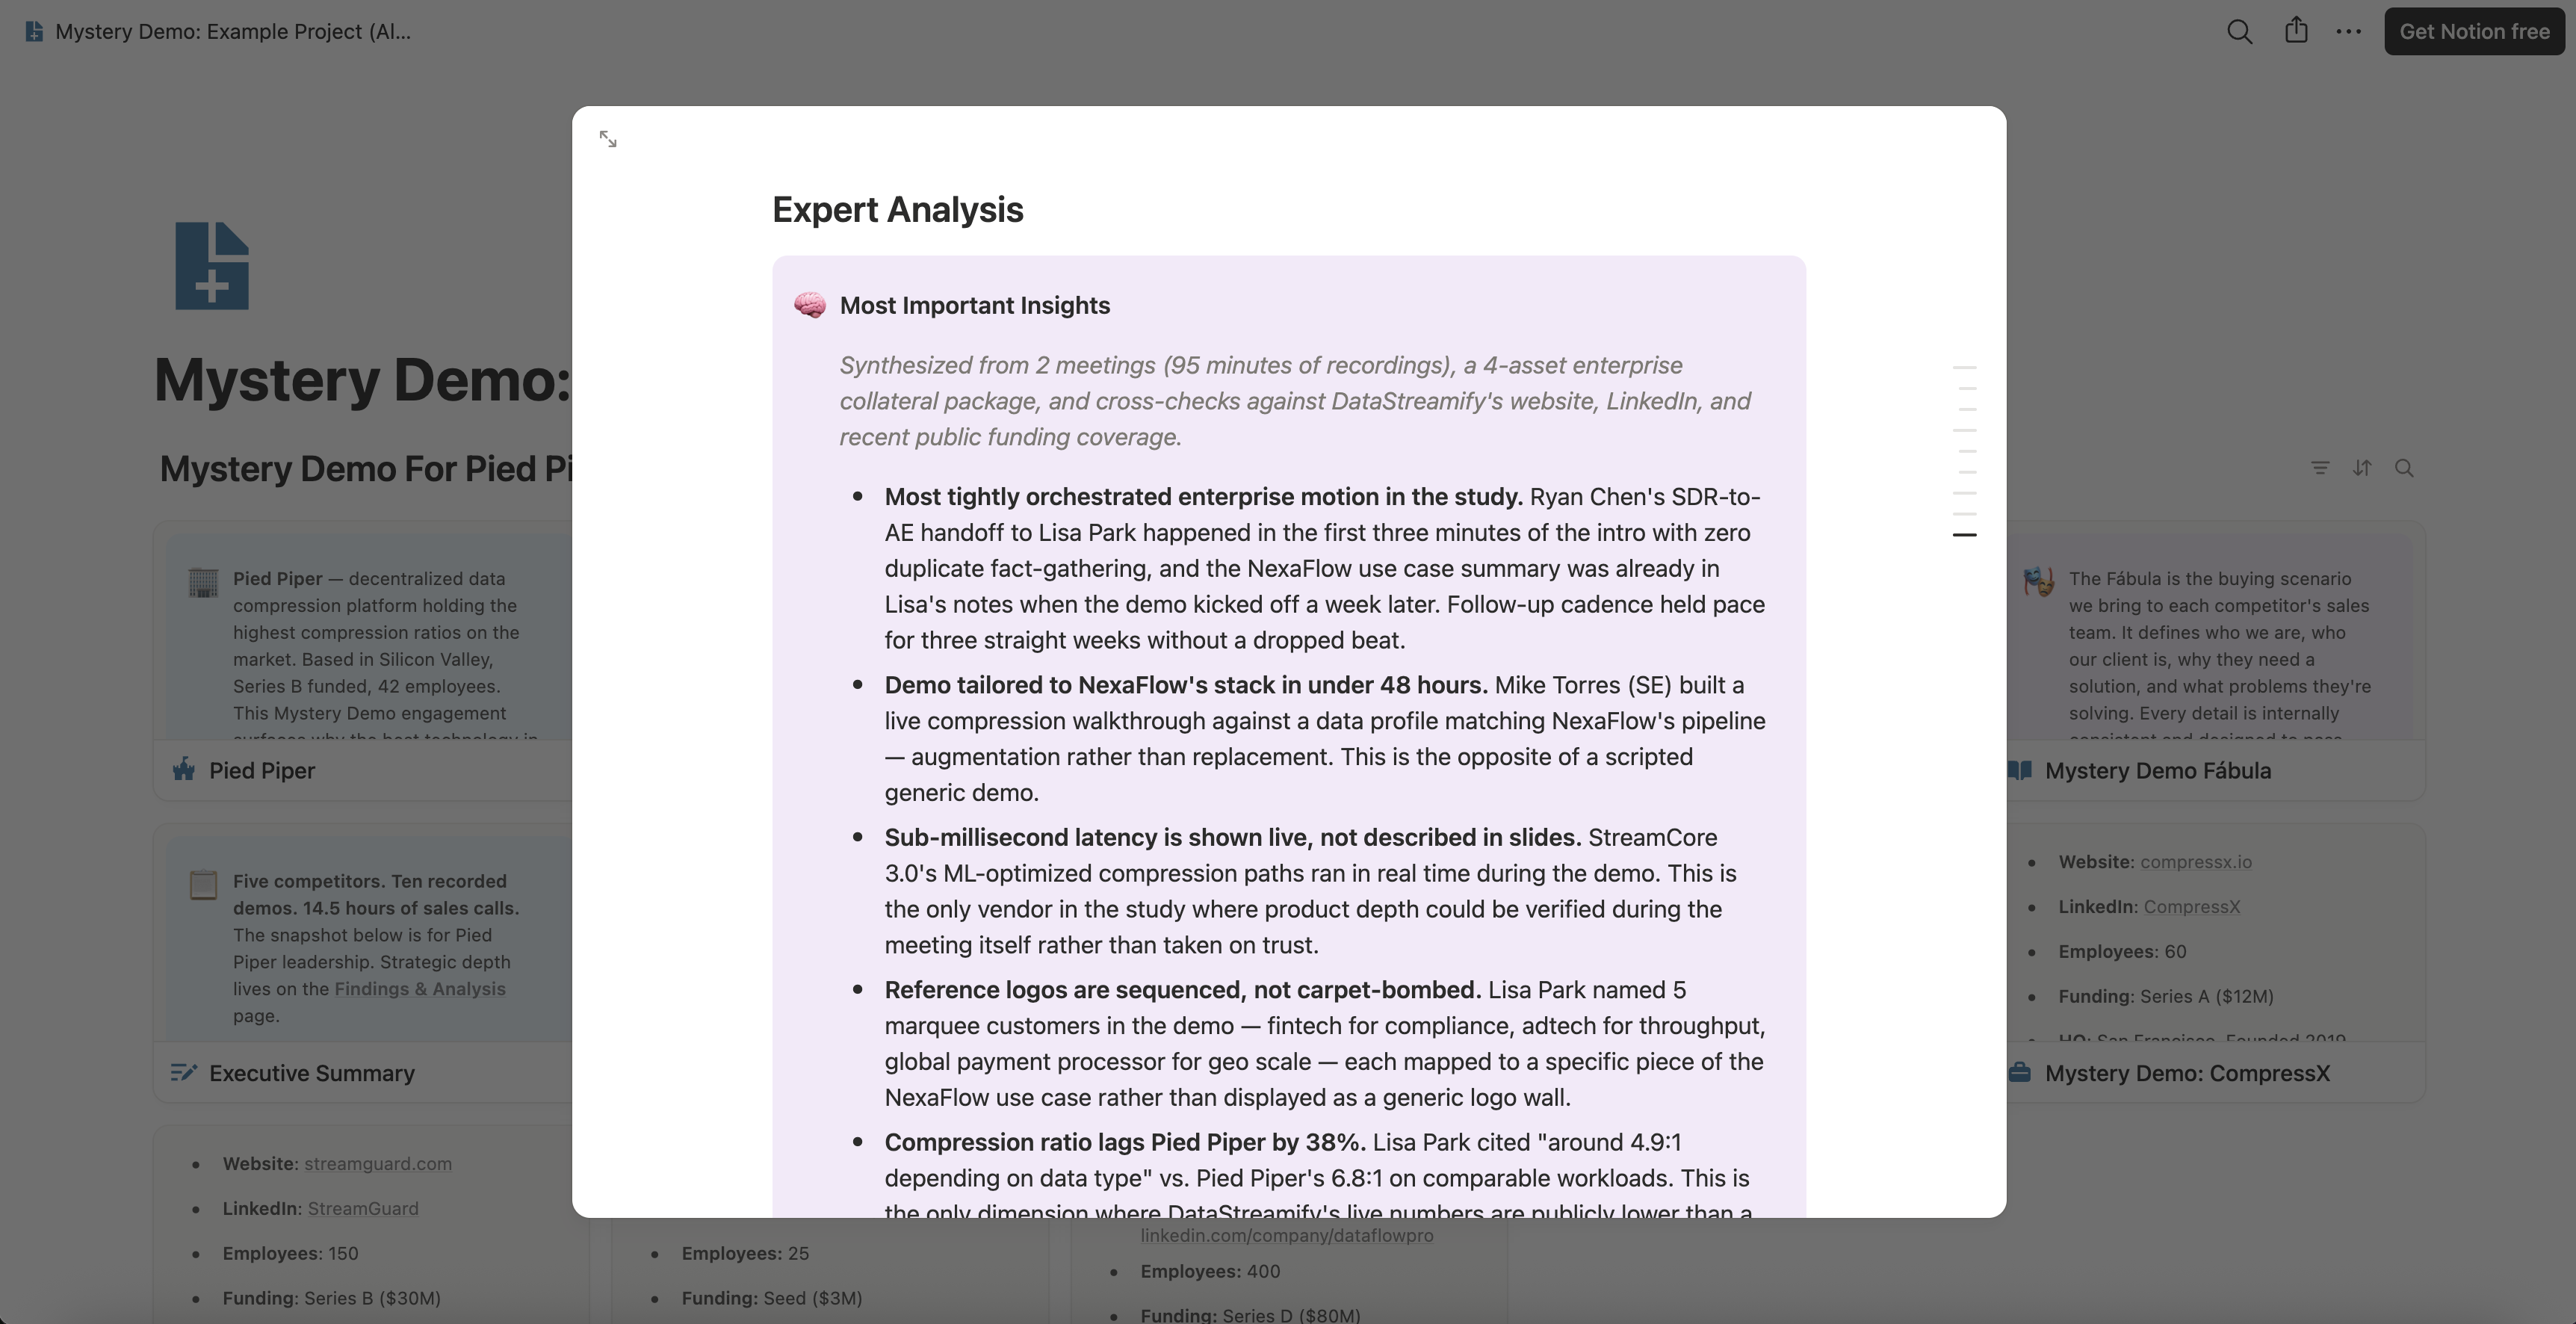
The line at the top names what the analysis was built from: the recorded meetings, the rival’s sales materials, and checks against its website, LinkedIn and public news. For a win-rate drop, four things come back from the rival’s calls:
The board’s Executive Summary pulls the rivals together. Its first section gives each one a line on where it wins and where it loses, and the sales scorecard under it grades how each one sells.
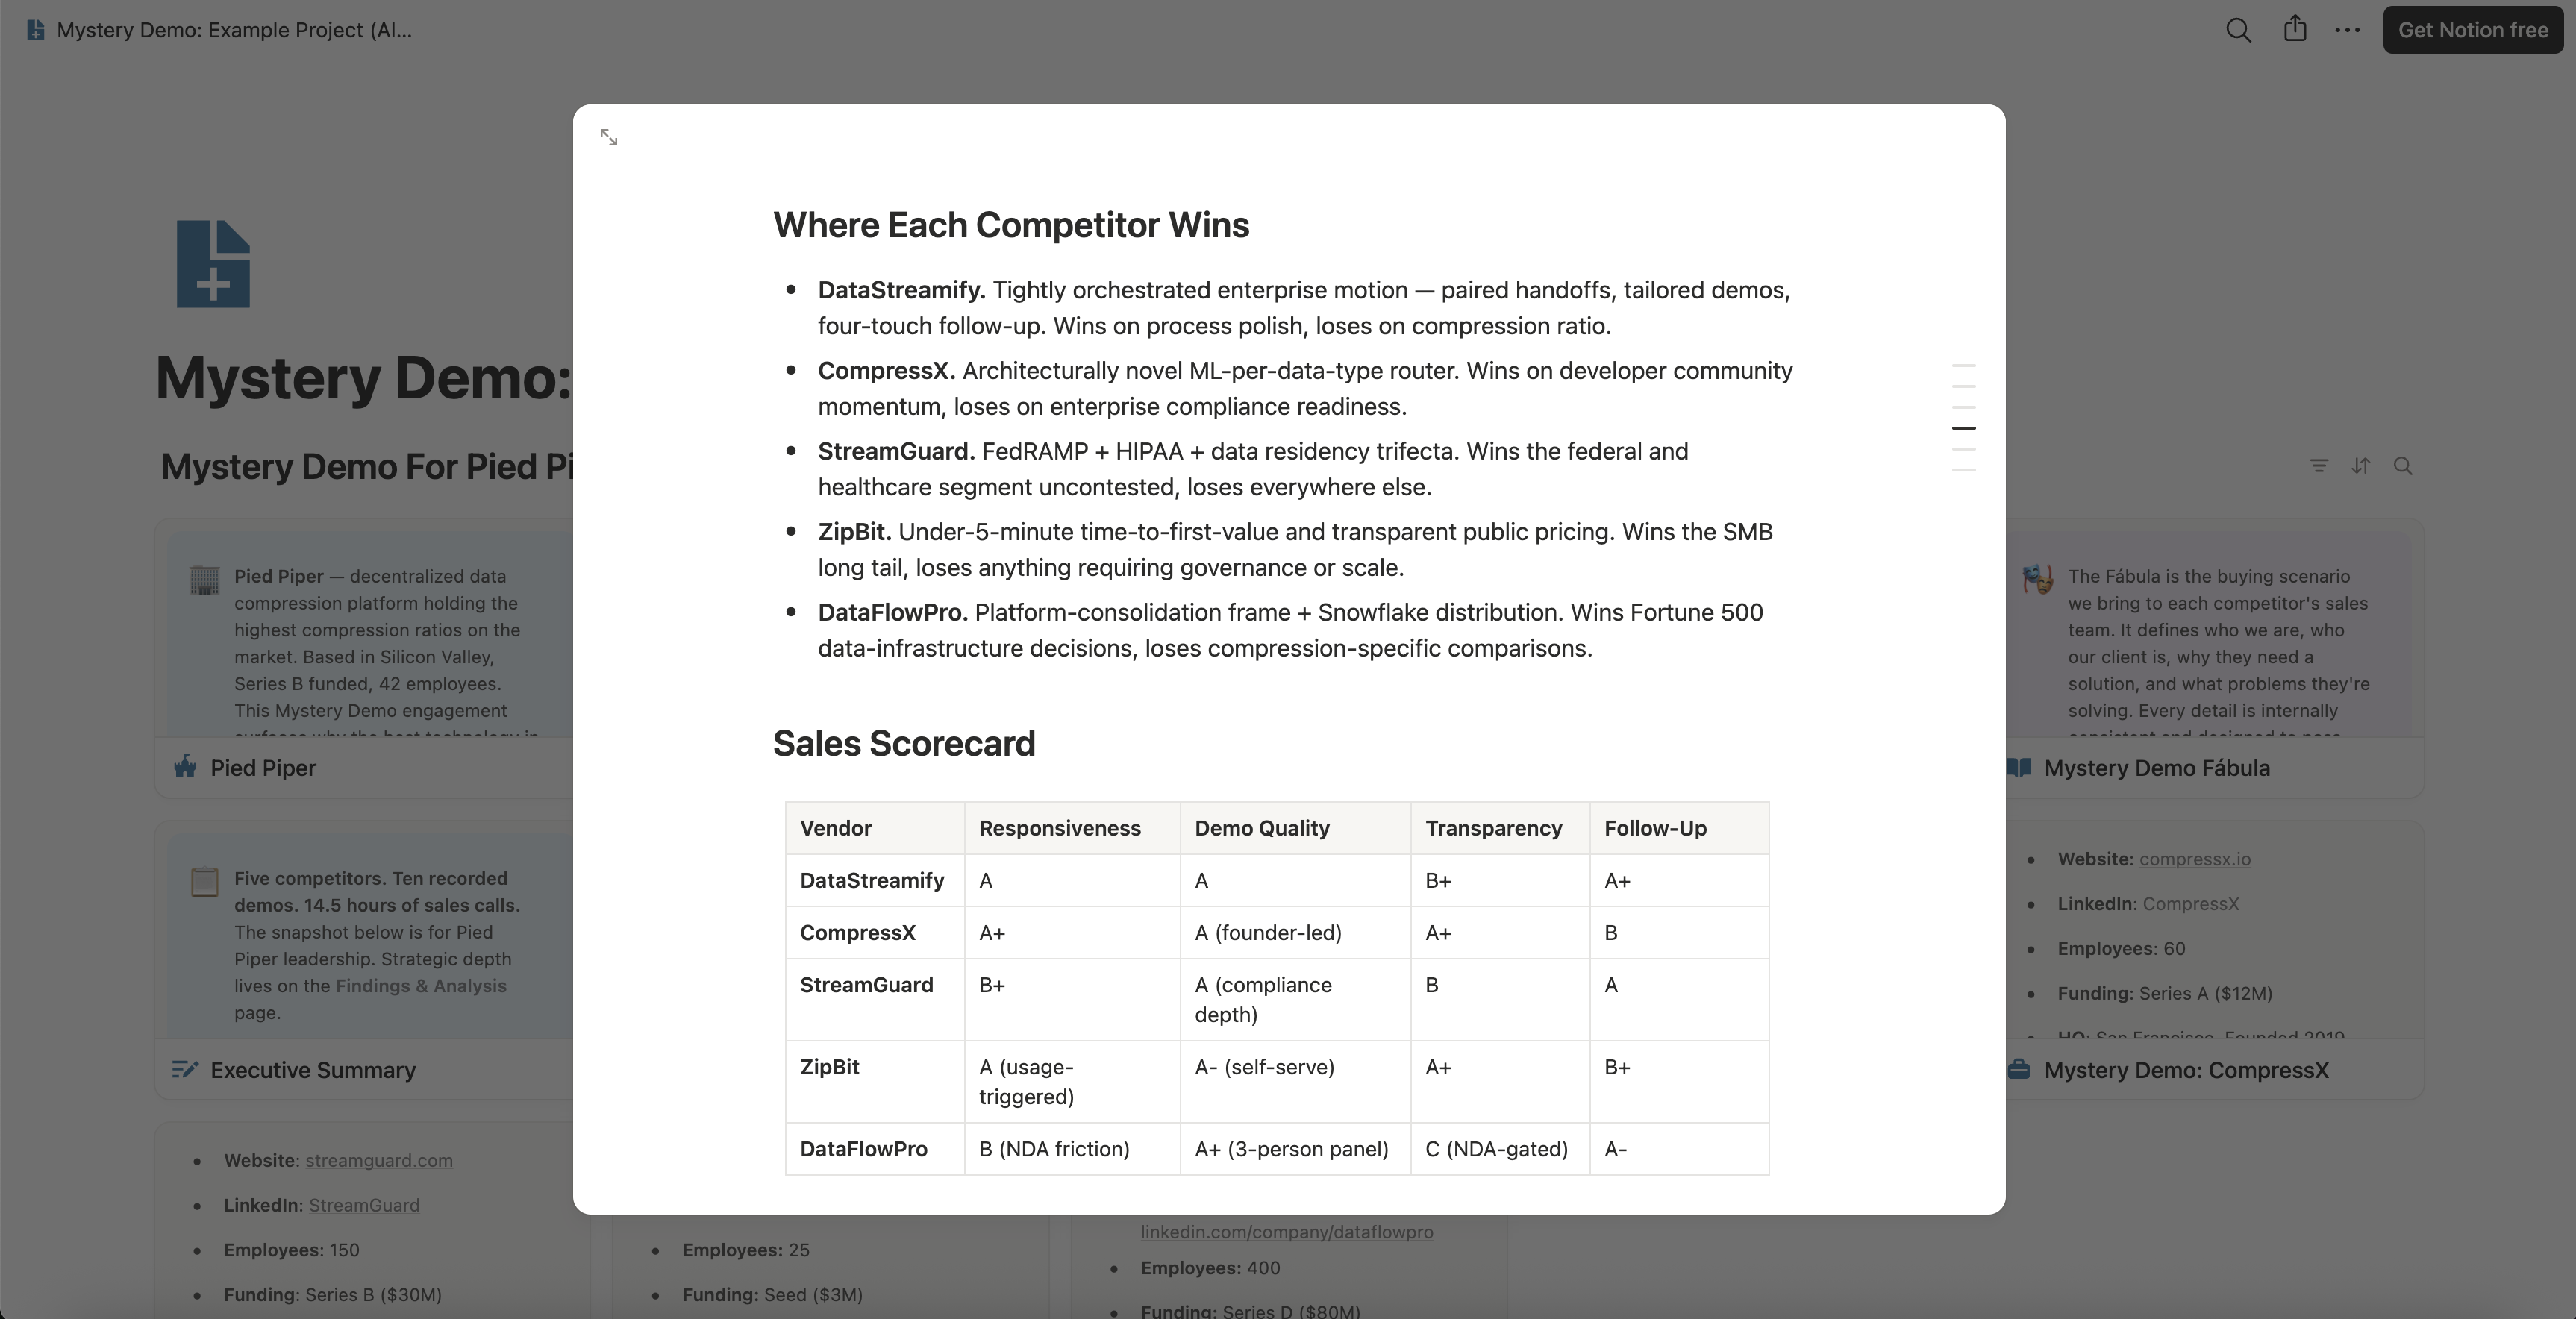
For a falling win rate, read the line for the rival you keep losing to. It names the kind of deal that rival is set up to win, in words taken from its calls, and you can hold it against the deals you lost.
A recording shows what a rival says now. To show that something changed, set it beside dated evidence from before:
Without that, what comes back is a strong lead, and lost buyers can confirm it or not.
If one rival owns your losses, name it. On a short intro call, we agree on the kind of deal to mirror. Then we go through that rival’s sales process as that buyer, and its current price, pitch and offer land on your board, each with its recording.
Step 3: Weigh Every Story Against Its Evidence
Go back to the sheet, one row per story. For each, write the evidence for it and the evidence against it, from Step 1 and from the rival’s calls if you ran them. Then write what is still unknown.
Keep every story the evidence supports, because several can be true at once. As another reply on that Reddit thread said, “All three could be true at the same time, you could be gaining share overall while losing a particular type of deal.”
A story holds when it sits where the drop sits, started no later than the drop did, and comes up in lost buyers’ own words. Then give every story that holds a next step of its own:
Recheck the win rate by segment once enough new deals have closed to read it, with the count beside every rate. A rival that changed its offer once can change it again, so keep the date on every line that came from its calls.
What a Week of Tests Can Settle
Most of the stories behind a falling win rate can be tested in your own data within a week, and a rival’s side within one or two more. By then the answer sits in one of four places:
A rival’s new offer is the one place your team can’t hear firsthand, because the rival says it to buyers, not to you. Tell us which competitor your losses point at. Start with a short intro call, and we will take the buyer’s seat in its sales process, so the rival’s row on your sheet is filled in its own words, recorded.


