
Usage pricing is no longer the exception in software. Per-usage pricing was the most common model in the contracts the procurement platform Vertice processed for its customers in the third quarter of 2026, at 37.1% of contracts.1
When buyers are asked how they want core software priced, fewer of them pick consumption. Among 830 IT decision-makers in The Futurum Group’s survey for the first half of 2026, the share preferring consumption pricing for core software fell 5.8 points, to 30.1%.2 For anyone who prices, sells or writes about software, the figures below cover how common seat, hybrid and usage pricing are, what buyers say about them, and how overages and commitments get handled, each from a public report.
A usage price has more parts than a seat price: the unit, the rate, the amount included, and what happens past the limit. Mystery Demo takes a software company’s competitors’ sales demos as a genuine buyer and brings back what each rep quoted for those parts. The client gets every quote on a shared board, recorded and set beside the rival’s published price.
Key Takeaways
The Most Common Contract Model Is the Hardest to Budget For
A buyer comparing you with a rival may be setting a seat price beside a metered or hybrid one, and has to forecast both bills. The sources do not share one set of definitions, so each table below keeps its own study’s terms. The three model names mean this:
Vertice is a software purchasing platform that also negotiates for its customers, and it measures all three models across more than $75 billion of spend it processed for them in 2026. Its third-quarter shares are preliminary.
| Vertice, 2026 | Seat-based | Hybrid | Usage-based |
|---|---|---|---|
| Contract share in Q3 2026 | 31.4%1 | 31.5%1 | 37.1%1 |
| Average monthly budget variance | 4.1%3 | 19.8%3 | 37.6%3 |
| Cost per user against seat pricing | the baseline | 21% higher on average8 | up to 37% higher8 |
The model that now leads these contracts is also the one whose monthly bill moves most. Between per-usage and hybrid, nearly 7 in 10 pricing models in Vertice’s data now include a variable element.1
The lead is recent. Per-usage pricing rose from 34.0% of contracts in Q1 2026 to 36.5% in Q2 and 37.1% in Q3, while per-user pricing fell from 35.0% to 32.4% and then 31.4%.1
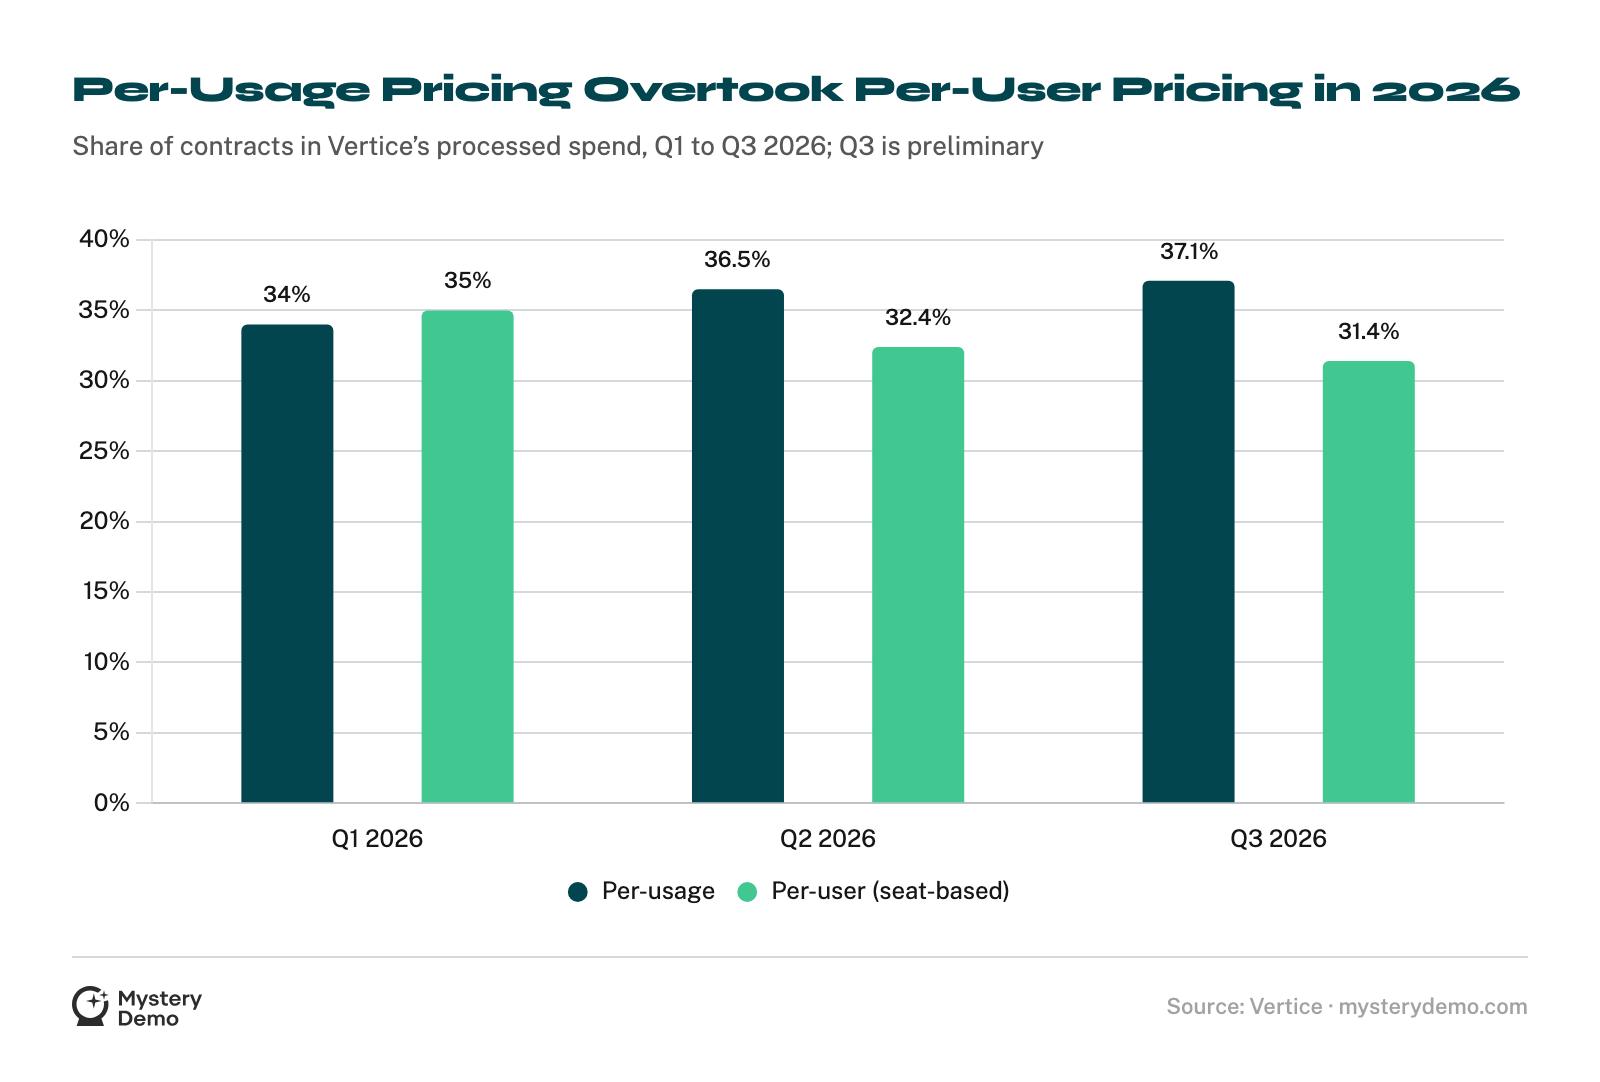
One firm’s contracts are one window on the market. The next question is how far usage pricing reaches among the companies that set prices.
Usage Pricing Reaches Well Beyond Infrastructure Software
For a sales team, metering is not just a habit of cloud and data vendors: a rival in almost any category may count part of its price in units of use.
Price Intelligently, SBI’s pricing practice, surveyed 321 SaaS operators and executives who own or influence pricing for its 2025 report, published in two parts. Some questions drew fewer answers, so each SBI figure below gives its own count. SBI says the pool leans up-market, with about 40% of respondents from enterprises.
| SBI’s pricing structure | What the customer pays for, in SBI’s words | Share of the 321 |
|---|---|---|
| Platform fee | a fee that includes usage up to a certain limit | 34.0%4 |
| Flat fee | a fee per month or year, with no usage in it | 23.4%4 |
| Usage-based | only what it uses | 21.2%4 |
| Base fee | access, with usage billed separately or on top | 14.6%4 |
| Other | not defined in the report | 6.2%4 |
| Outcomes-based | not defined in the report | 0.6%4 |
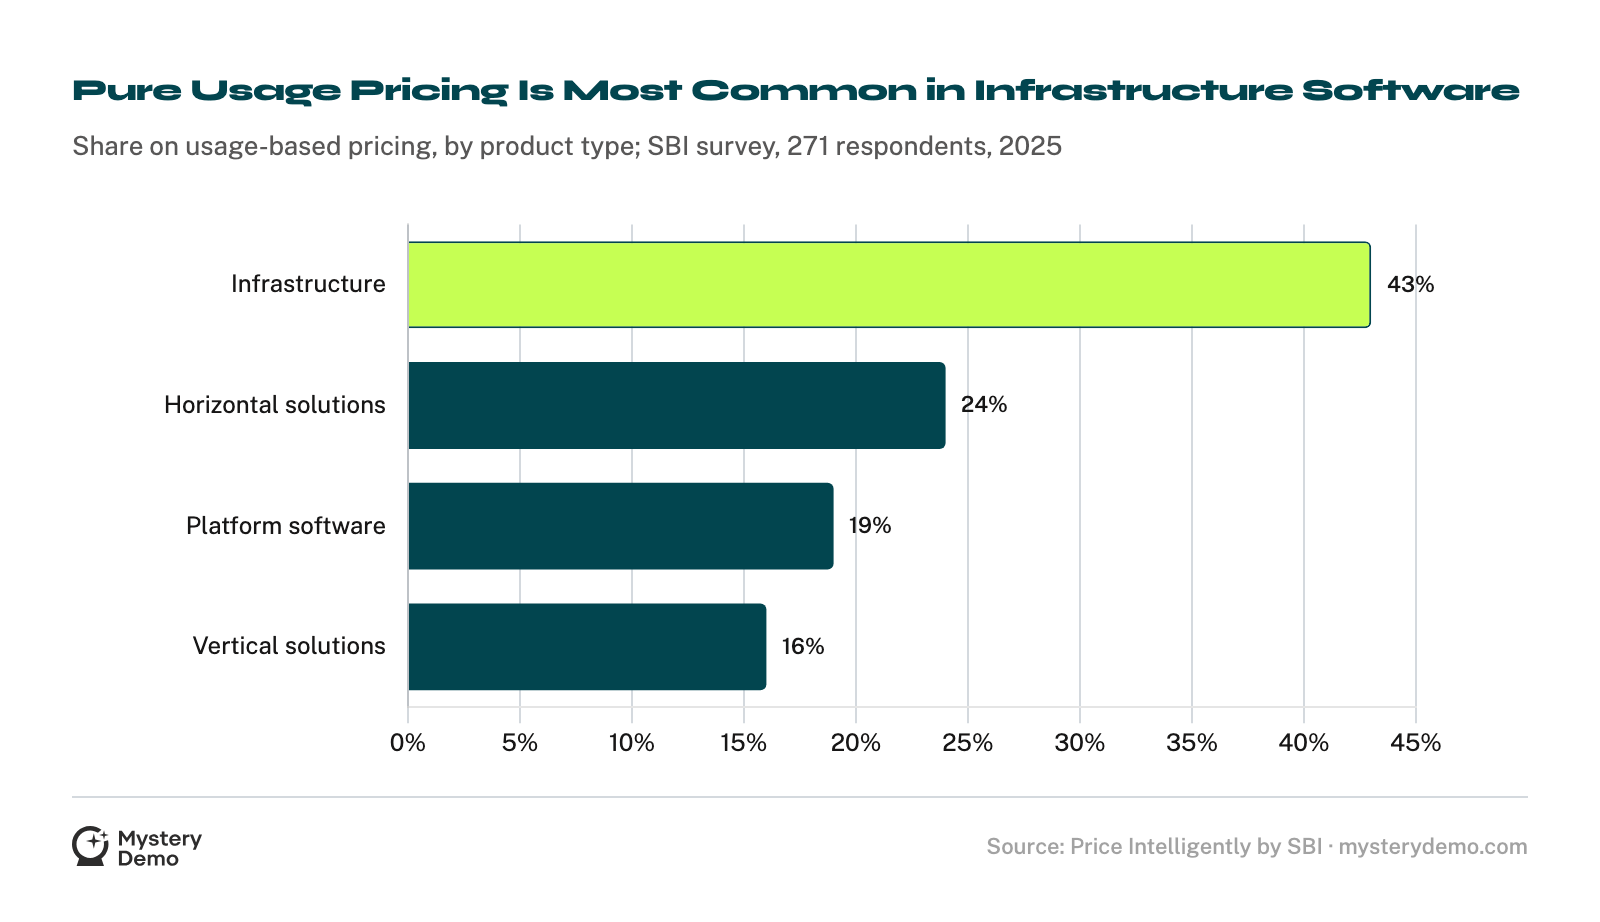
Of the four structures SBI defines, only the flat fee keeps usage out of the price. By product type, pure usage pricing is most common in infrastructure software: among 271 respondents, it was the structure for 43% of infrastructure companies and for 16% to 24% of the other three types.7
Two 2026 surveys count the mix their own way, so read each row on its own:
| Survey and who was counted | What it counted | Share |
|---|---|---|
| PwC UK and m3ter, March 2026: more than 350 UK software leaders | B2B respondents running usage or hybrid models in some form | 52%5 |
| Growth Unhinged, April to May 2026: more than 230 software companies | companies with hybrid pricing (25% said they were hybrid 12 months earlier) | 37%9 |
| Growth Unhinged, the same companies | companies letting customers choose between pricing models (21% the year before) | 29%9 |
m3ter, which ran the first survey with PwC UK, sells software for billing usage-based pricing. Growth Unhinged is Kyle Poyar’s newsletter.
Sellers on usage pricing also report doing well. Among SBI’s 271, 68% of companies on usage-based pricing said they were at or above their growth targets, the highest of the four defined structures, against 55% for base-fee companies.7 That is a pattern in one survey, not proof that the model caused the growth.
Usage spreading has not pushed seats out of the price. Most of these companies still count people somewhere.
Seats Are Rarely the Only Thing a Buyer Pays For
For a sales team, the seat count is still part of most quotes, but it is seldom the whole price. More than 80% of SBI’s 321 respondents use some kind of seat-based metric in their pricing.4 Seats are the only value metric for 8% of them.4
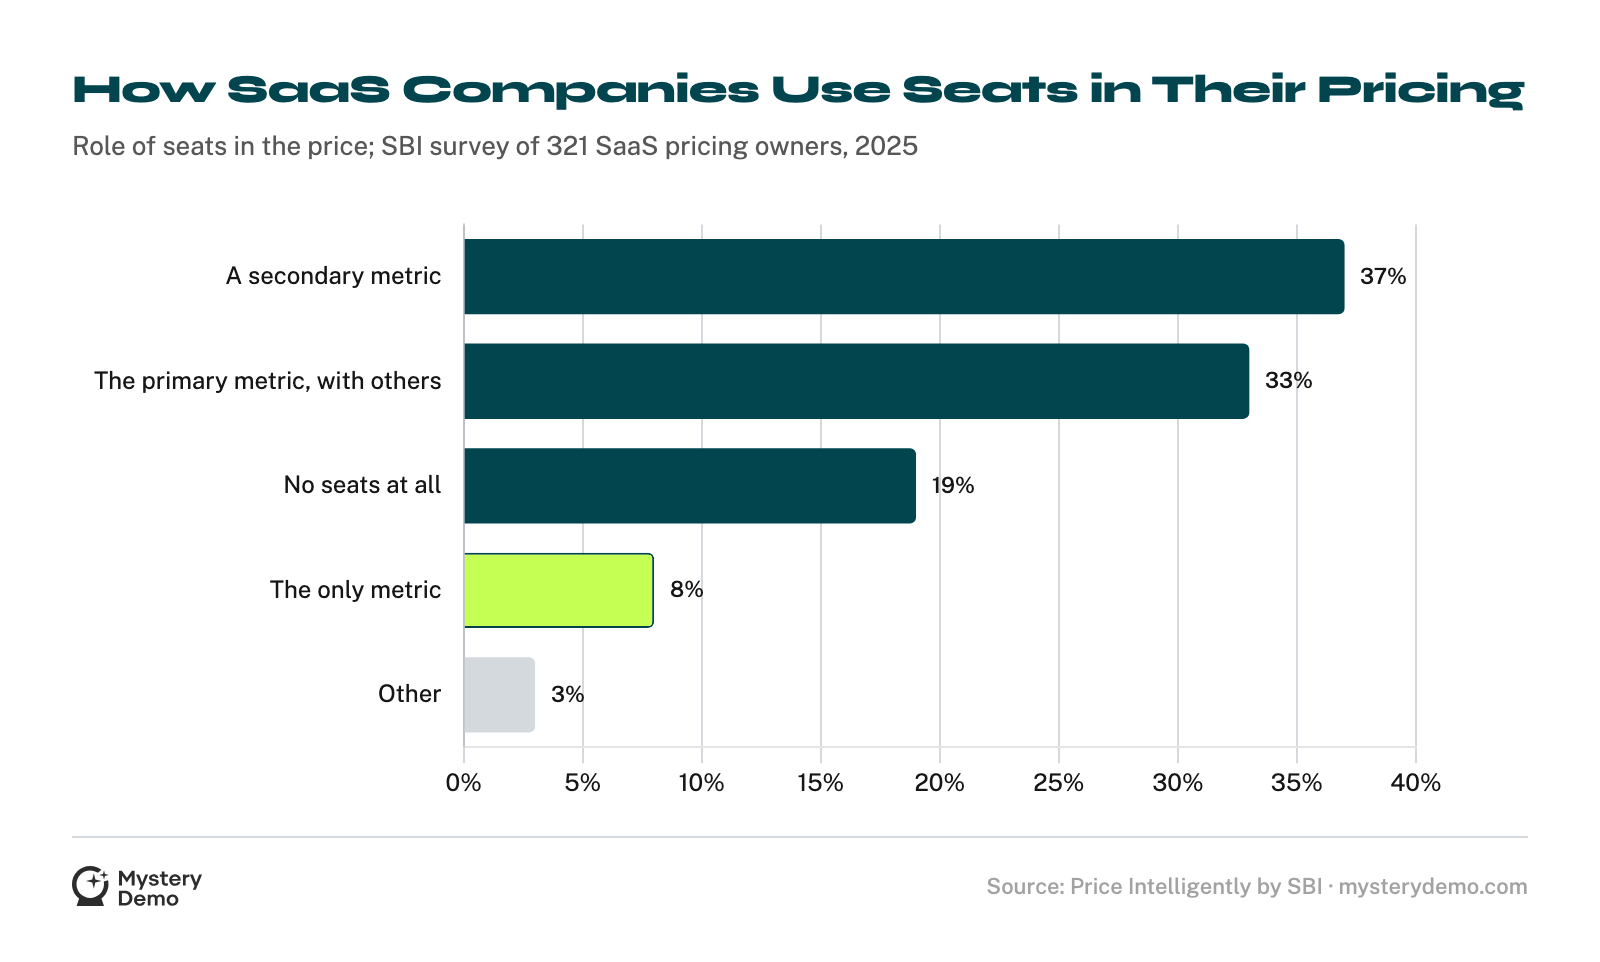
For most of them, seats are one metric among several, sometimes the main one and sometimes a secondary one. In the Growth Unhinged survey, 29% of companies above $150 million in annual recurring revenue still priced per seat.9 In Vertice’s contracts, per-user pricing became the least common of the three models for the first time in Q3 2026.1
Newer ways of charging sit beside the seat, at very different stages:
When software does work a person used to do, the argument goes, the number of people logging in stops tracking what the software is worth. None of these surveys shows that AI agents caused the changes above, so read it as an argument, not a finding. Whatever sits beside the seat, the buyer still has to budget for it.
Buyers Are Pulling Core Software Back Toward Fixed Prices
A buyer who hesitates over a usage term may be thinking about a bill they cannot forecast, so be ready to show what a typical month would cost.
The Futurum Group asked 830 IT decision-makers worldwide how they prefer to pay for software, comparing the first half of 2026 with the second half of 2025. For core software platforms, three preferences moved:
| Preferred pricing for core software | 2H 2025 | 1H 2026 |
|---|---|---|
| Consumption-based | 5.8 points higher | 30.1%2 |
| Perpetual or fixed price | 18.7% | 22.5%2 |
| Outcome-based | 18.4% | 21.7%2 |
Consumption is still the most preferred of the three, but Futurum reads its fall as buyers retreating toward predictability. The same release says buyers moved toward metering for generative AI features. Those figures belong with our SaaS AI pricing statistics.
In Zylo’s January 2026 survey of 218 IT leaders, 78% had unexpected charges tied to consumption-based or AI pricing in the previous 12 months.6 Zylo sells SaaS management software, and its question puts the two kinds of pricing together. On the seller side, 31% of the software leaders in the PwC UK and m3ter survey report customer billing dispute rates of 5% or more, across their billing as a whole.5
In a heavy month, much of what a customer pays depends on what happens at the usage limit.
The Most Common Overage Rule Is a Conversation
For a sales team, a customer going past its usage limit can land on a rep’s desk: in one survey, that was the most common way overages were handled.
SBI asked how companies enforce overages. Its report frames the answers as coming from respondents with a usage component in their pricing, while its chart prints a base of 321. Sending the customer to Sales or Customer Success to discuss the overage came first, at 23%.4
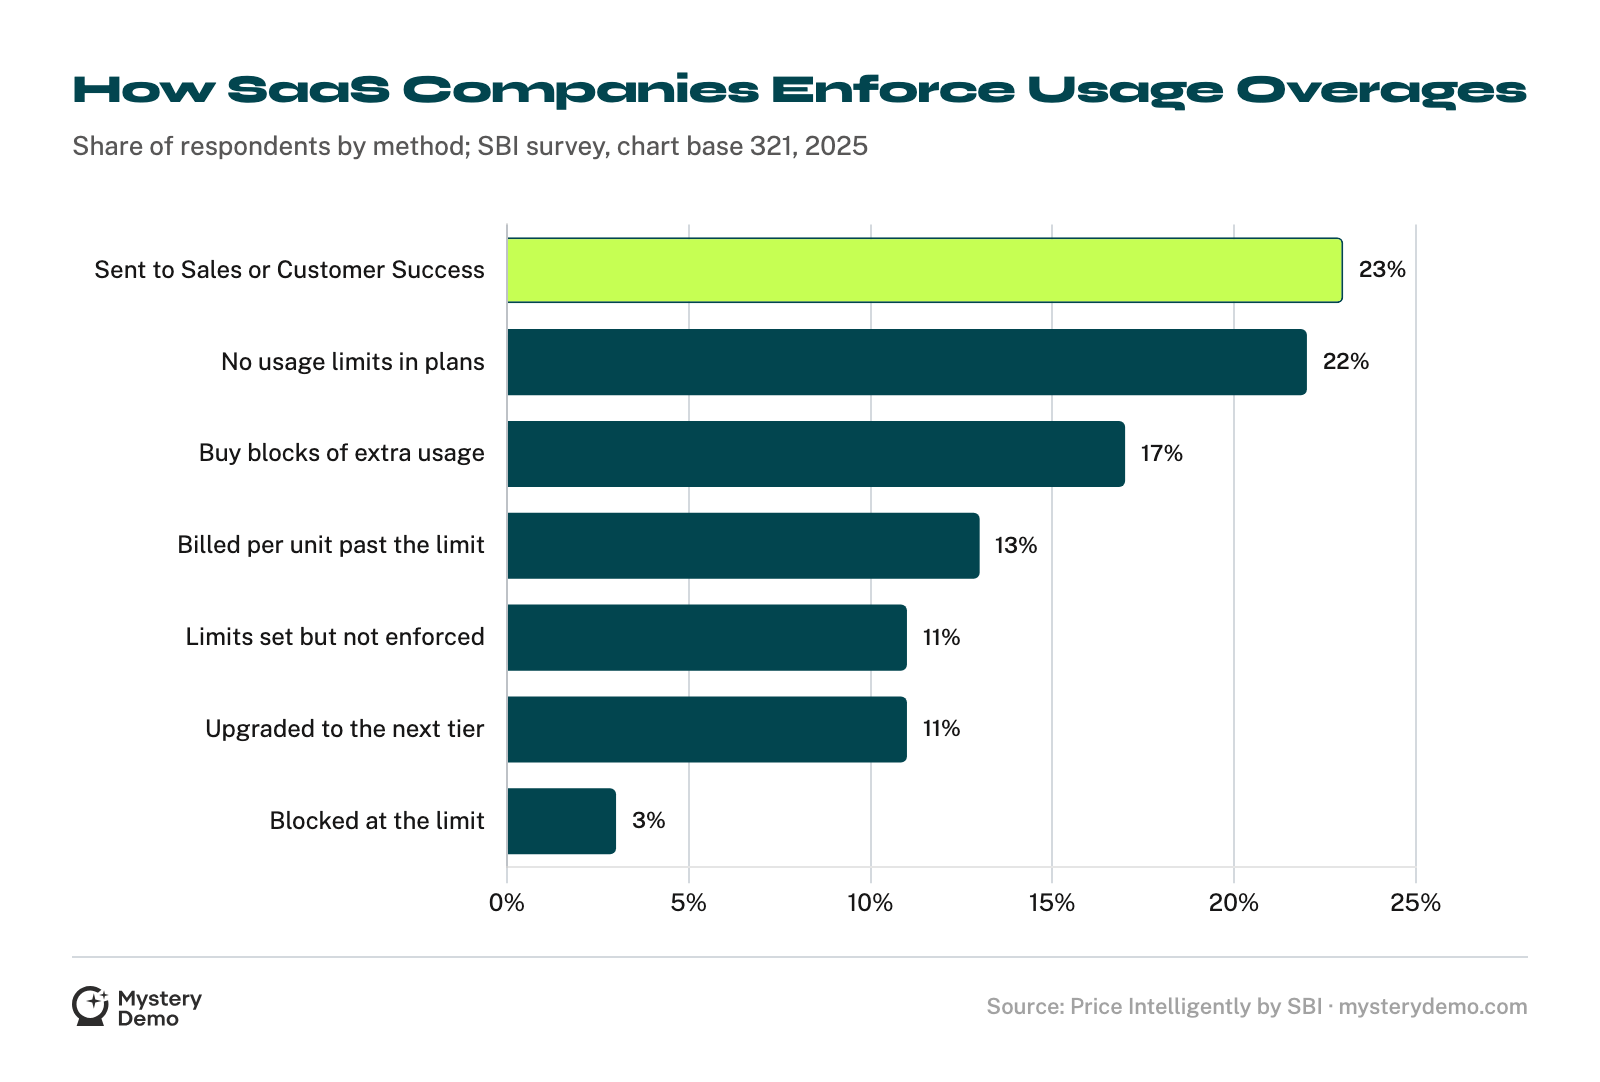
SBI’s second report breaks the same question out by pricing structure, among 299 respondents:
Measuring the usage is its own problem:
One cause of that lost revenue, in the report’s own list, is usage above contracted limits that never gets billed. The limit itself, and what the customer commits to before any overage, are set earlier, in the contract.
Minimum Commitments Rest on a Usage Forecast
A usage deal can come with a floor, and a rep should be able to explain it in plain words. Three terms are worth having ready:
No survey we could find counts how often usage deals carry a minimum, with a stated population behind the number. A commitment is sized from a usage forecast. The data does show how fast those forecasts move: in Vertice’s 2026 spend data, a consumption-priced contract drifts more than 15% from its original forecast in less than six months.3
A floor set on that forecast can end up above what the customer uses, or far below it. Vertice tells the buyers it works for to negotiate guardrails into usage deals: overage limits, a warning from the vendor before a limit is reached, and tiered prices by volume.3 Each of those terms is settled in a negotiation, which raises the question of how much of any software price reaches the page.
Many Software Prices Never Reach the Pricing Page
Sales-led companies publish far less than product-led ones. 69% of the sales-led software companies in SBI’s survey publish no prices or packages on their website, by their own account.7 Among product-led companies, 42% publish all of them.7
Outside counts point the same way:
The prices that are published also move. Three in four companies in the Growth Unhinged survey changed pricing or packaging within the last year.9 Over 50% of the software leaders in PwC UK and m3ter’s survey amend pricing twice or more a year.5

A Rival’s Usage Terms Come Out When a Buyer Asks for Them
Every figure above describes a market, a survey pool or one firm’s contracts. None of them says what your closest rival charges past the limit, how large a commitment it asks for, or what it gives up to close a buyer your size.
On a Mystery Demo project, those answers land on the pricing matrix, the page of the board where each competitor’s quoted terms sit beside its published ones. The page below comes from our public example board, where the client and all five competitors are invented. Each row is one competitor, with its pricing model, its lowest price, the unit it charges by, and how openly it shared the price, from fully public to given only partway through a call.
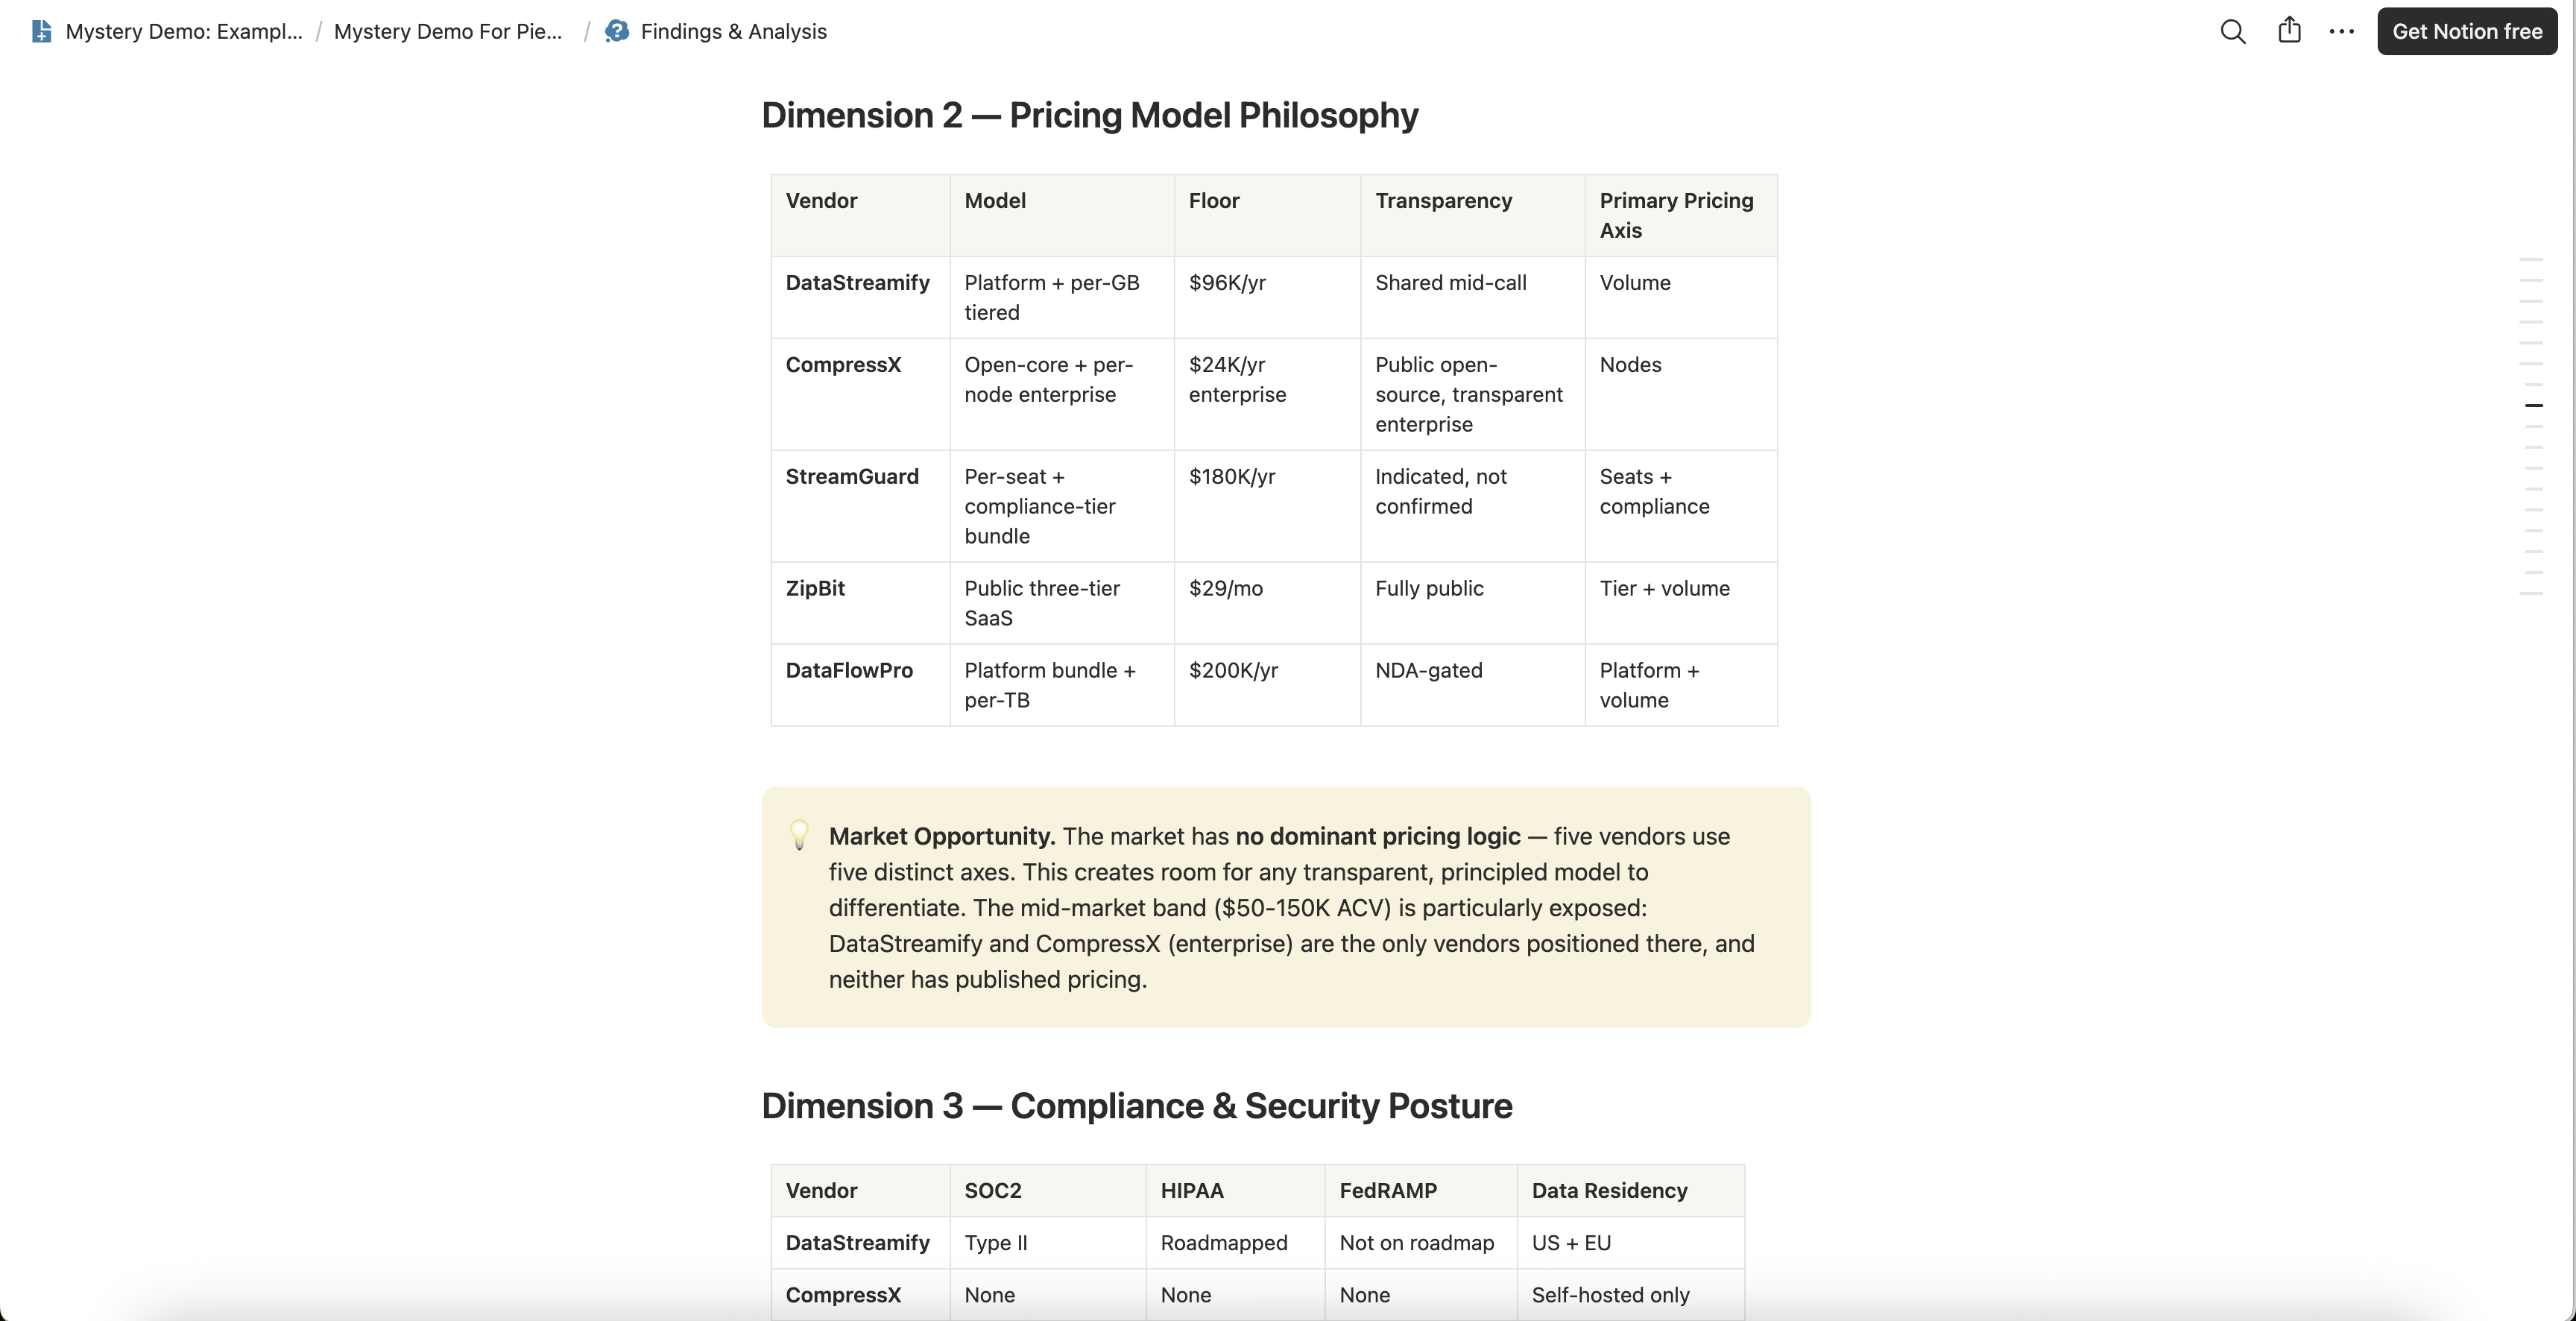
On a real project, every cell comes from that competitor’s own sales calls, and the page also carries the terms the rep quoted around the price: the limit, the overage rate and the commitment asked for. For your own rivals, that page comes from SaaS competitor pricing research: a flat €499 per competitor, the board ready in one to two weeks, and every quoted term tied to the minute it was said. Name the competitor whose usage price your reps keep guessing at in a first conversation with us, and we will ask for its price the way your buyers do.
Frequently Asked Questions
What Share of SaaS Companies Use Usage-Based Pricing?
21.2% of 321 SaaS executives who own or influence pricing, in SBI’s 2025 survey, priced purely on usage.4 In PwC UK and m3ter’s 2026 survey of more than 350 UK software leaders, 52% of B2B respondents run usage or hybrid models in some form.5
Is Seat-Based Pricing Declining?
31.4% of contracts in Vertice’s preliminary Q3 2026 data were priced per user, down from 35.0% in Q1 and now the least common of three models.1 Seats are the only value metric for 8% of SBI’s 2025 respondents.4
Is Usage-Based Pricing Harder to Budget Than Seat Pricing?
37.6% was the average monthly budget variance under consumption pricing in Vertice’s 2026 spend data, against 4.1% under seat pricing and 19.8% under hybrid.3
Do Buyers Prefer Consumption Pricing for Core Software?
30.1% of The Futurum Group’s 830 IT decision-makers preferred consumption pricing for core software platforms in the first half of 2026, down 5.8 points from the half before.2
How Do SaaS Companies Handle Usage Overages?
23% of SBI’s respondents send a customer who passes a usage limit to Sales or Customer Success, the most common answer.4 Billing per unit above the limit came to 13%, and blocking the customer to 3%.4
Can a Pricing Page Tell Me a Competitor’s Usage Terms?
69% of sales-led software companies in SBI’s survey publish no prices or packages on their website.7 Dupple found a third of 377 software tools gating at least one pricing tier behind a sales conversation.10
References
- Vertice: SaaS Pricing Models (2026)
- The Futurum Group: 42.9% of Buyers Prefer Consumption Pricing for GenAI; Reject It for Core SaaS (2026)
- Vertice: Budget Variance Rates: Consumption vs Seat Pricing (2026)
- Price Intelligently by SBI: 2025 State of SaaS Pricing Report, Part 1
- PwC UK and m3ter: Revenue Integrity and Optimisation in the Era of AI and Usage Based Pricing (2026)
- Zylo: 2026 SaaS Management Index
- Price Intelligently by SBI: 2025 State of SaaS Pricing Report, Part 2
- Vertice: Consumption Pricing: Cost-Per-User vs Seat-Based (2026)
- Growth Unhinged: The State of B2B Monetization in 2026
- Dupple: One in Three Software Vendors Hides Its Price (2026)
- Vertice: Average Discount From List Price (2026)


