
Your pricing page is doing the selling whether you staffed it or not. Buyers spend 70% of the buying journey1 researching before they talk to a vendor's sales team, and they start that conversation themselves 83%1 of the time. By the time a rep says hello, the price question is already answered.
Which is why we spend our time on the other side of that page. A client names the competitor, we build a fábula (a believable company profile and buying scenario), book the demo as an ordinary prospect, and bring back the number nobody publishes.
What follows is what the data says about pricing pages, demo pages, and the price you either show or hide. The references at the end name every dataset quoted here.
The Buyer Finishes Most of the Evaluation Before You Know They Exist
That 70%1 comes from a survey of over 900 B2B buyers who made a purchase over $10,000 in the past two years. The study found the point of first contact holds constant regardless of industry, department, solution and purchase type, and purchase price. Big deal or small, they arrive late.

Preference is moving the same way. In a Gartner survey of 646 B2B buyers run in August and September 2025, 67% said they prefer a rep-free buying experience2.
Familiarity sharpens it. Among 148 respondents involved in technology purchase decisions, those already familiar with the product or service preferred a 100% digital, self-service purchase 64%3 of the time.
Your Pricing Page Outdraws Your Demo Page and Converts Worse
HockeyStack Labs looked at 31 million unique visitors across 80 B2B SaaS websites, each running both a pricing page and a demo page, average ACV between $5K and $120K. Pricing pages pulled 16.5% of total website traffic4. Demo and contact-sales pages pulled 0.91%4.
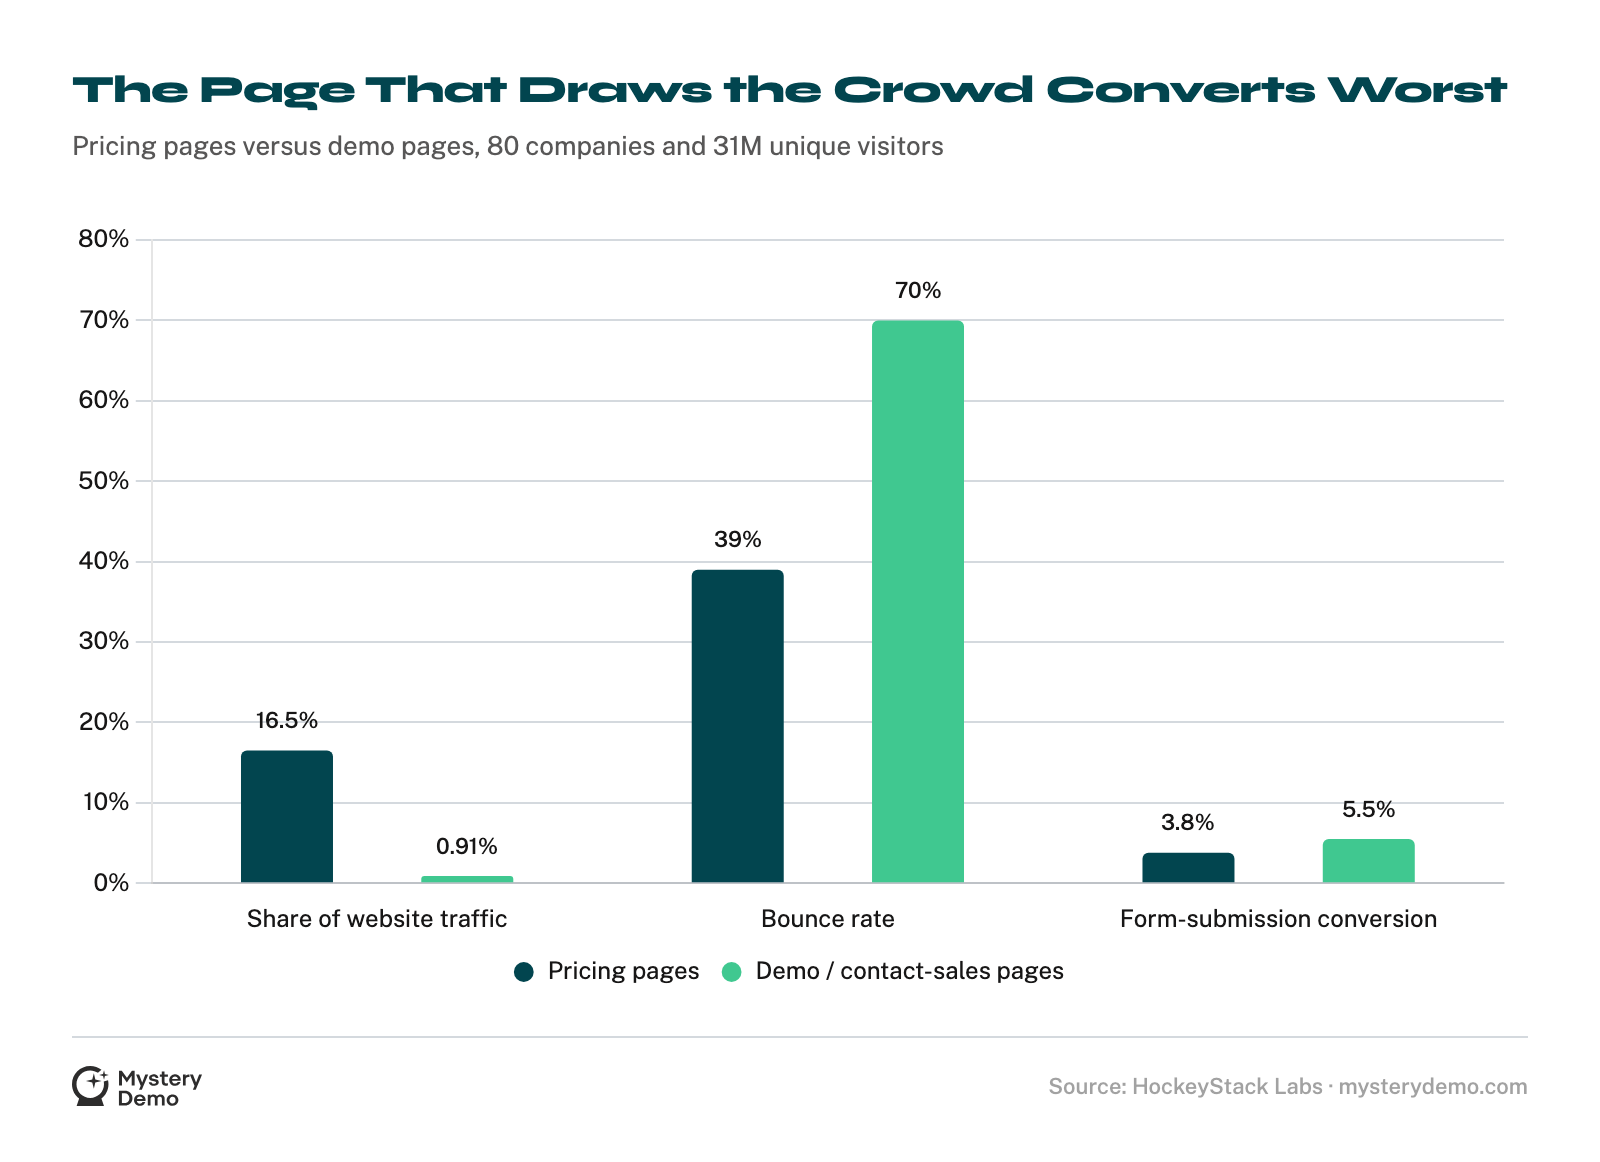
A separate section of the same report counts unique visitors instead of traffic share, and there the pricing page draws 13x more of them4 than the demo page. Two different metrics, measured two different ways. The direction is the thing they agree on.
Bounce rates say the traffic is not accidental. Pricing pages averaged a 39% bounce rate4. Demo pages averaged 70%4, so most demo-page visitors leave without doing anything at all.
Then the conversion numbers invert. Pricing pages convert visitors into form submissions at 3.8%4; demo pages hit 5.5%4. Blended across pricing pages that show a price and pricing pages that don't, demo pages convert 1.44x better4.

.png)
Hiding the Price Buys You Form Fills and Costs You Pipeline
Inside pricing pages only, the split is clean. Pages that show a transparent price convert 2.8%4 of visitors into form submissions. Pages that put the price behind a contact-us form convert 4.6%4. The gate wins that contest.
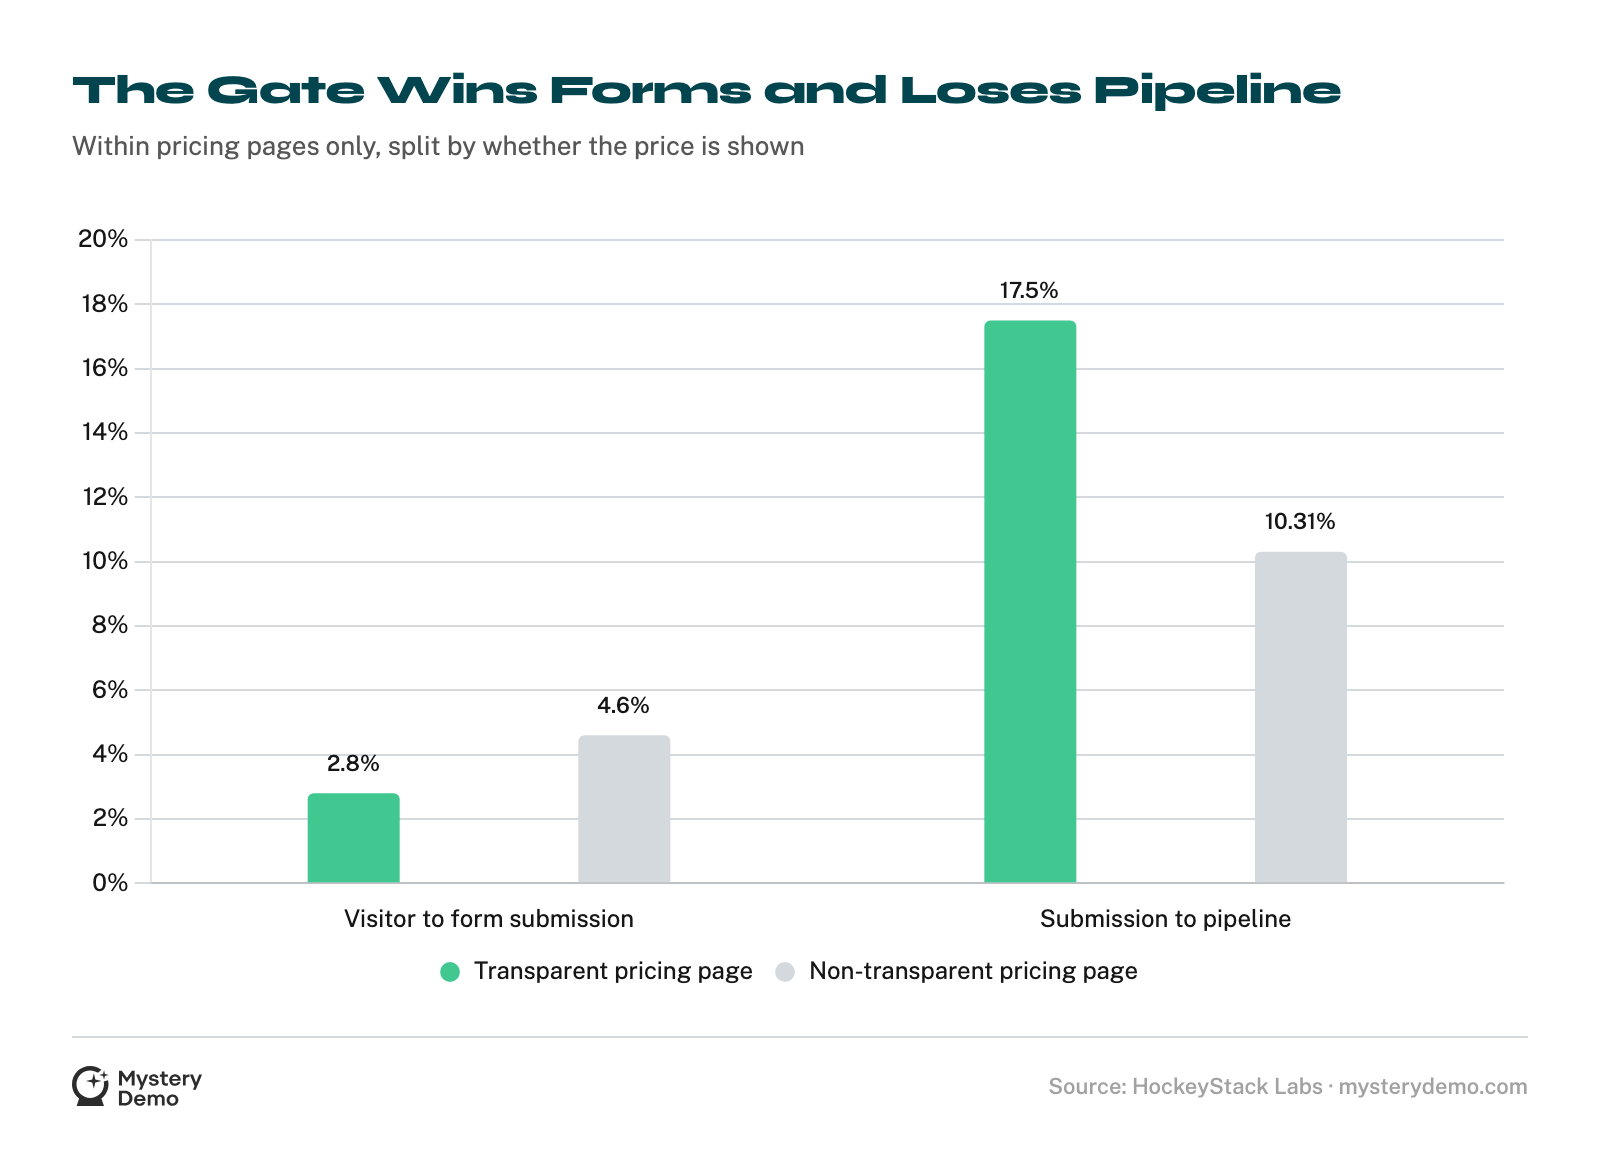
Pipeline tells a different story. Leads from non-transparent pricing pages convert to pipeline at 10.31%4. Leads from transparent ones convert at 17.50%4, which the report puts at 1.7x4 better. You bought more forms and fewer deals.
Note which cut is which. The 3.8% versus 5.5% figure compares pricing pages against demo pages. The 2.8% versus 4.6% figure lives inside pricing pages only, sorted by whether the price is on them. Same dataset, different questions.
The hidden price also suppresses the demo request it was supposed to create. Using matched control and treatment groups, visitors landing on a non-transparent pricing page were 9.5% less likely4 to go on to submit a demo form.
Engagement thins out too. Visitors who don't bounce view 2.574 pages on a site that hides its price against 4.26 pages4 when it's transparent, 65%4 more. On-site time runs 2 minutes 31 seconds4 versus 3 minutes 25 seconds4.
None of that is visible from your own dashboard, because your own dashboard only watches your own page. This is the part we go and collect from a competitor's funnel:
Counting Paying Customers Per Visitor Changes Which Model Wins
ChartMogul and ProductLed surveyed 200 B2B software products in January 2026, typical respondent between $1M and $10M ARR. The spread is the headline: a 10x conversion difference5 separates the top 20% of self-serve products from the bottom 20%.
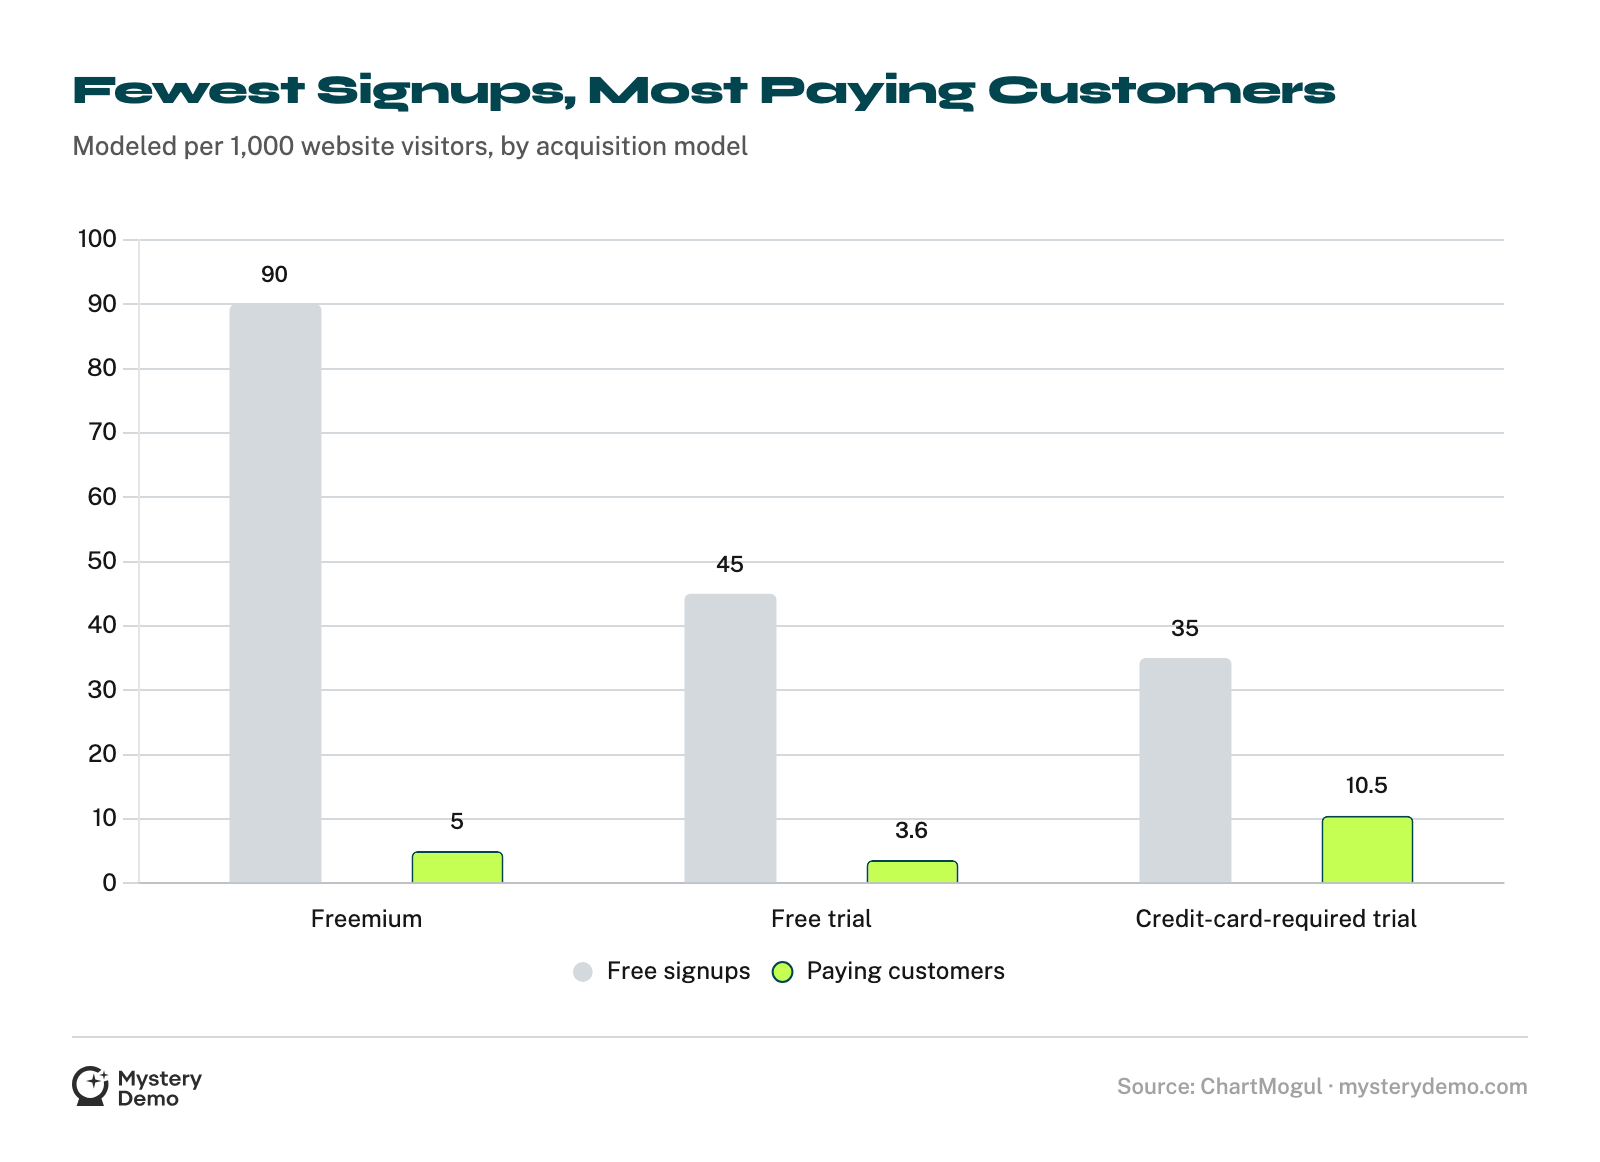
Model that same base as 1,000 website visitors and the ranking stops behaving. Freemium turns them into 905 free signups and 5 paying customers5, a 5.5%5 free-to-paid rate. Free trial products post 455 signups and 3.65 paying customers.
Free trials convert signups to paid at a slightly higher rate than freemium. That difference, in the report's words, gets wiped out upon accounting for signup rates. Fewer people start, so fewer people finish.
Credit-card-required trials look worst at the top of the funnel and best at the bottom. They draw the fewest signups of the three, 355 per 1,000 visitors, and produce the most paying customers, 10.55. Asking for a card is a filter, and the filter pays.
Small moves are worth real money at this end. A 1-percentage-point improvement in free-to-paid conversion works out to roughly a 15% increase in new revenue per trial6.
Frequently Asked Questions
How Much of the B2B Buying Journey Happens Before a Buyer Talks to Sales?
About 70%1, among B2B buyers who made a purchase over $10,000 in the past two years. The survey covered over 900 buyers, and found the point of first contact held constant across industry, department, solution and purchase type, and purchase price.
Do Buyers or Sellers Make First Contact?
Buyers, 83%1 of the time in that same survey. Many sellers don't learn a deal exists until the buyer raises a hand.
Do B2B Buyers Want to Talk to a Sales Rep at All?
Often no. In a Gartner survey of 646 buyers run in August and September 2025, 67%2 said they prefer a rep-free buying experience. Among 148 technology purchase decision-makers, those familiar with the product preferred a fully digital purchase 64%3 of the time.
How Much Traffic Does a Pricing Page Get Compared to a Demo Page?
In an 80-company, 31-million-visitor B2B SaaS dataset, pricing pages took 16.5%4 of website traffic against 0.91%4 for demo pages. A separate cut of the same report counts unique visitors rather than traffic share, and puts pricing pages at 13x4. Two measures, one direction.
Which Converts Better, a Pricing Page or a Demo Page?
Demo pages. Pricing pages average 3.8%4 form-submission conversion against 5.5%4 for demo pages, a 1.44x4 gap. That figure is blended across transparent and non-transparent pricing pages alike.
Does Showing Your Price Hurt Conversion?
On the form, yes. Within pricing pages, transparent pricing converts 2.8%4 of visitors into submissions against 4.6%4 when the price is hidden. Downstream it reverses: those transparent-page leads reach pipeline at 17.50%4 versus 10.31%4, which the report reads as 1.7x4 better.
Does Hiding the Price at Least Drive More Demo Requests?
The lift analysis says the opposite. With matched control and treatment groups, visitors on a non-transparent pricing page were 9.5%4 less likely to submit the demo form than visitors on a transparent one.
Does Hiding the Price Change How People Use the Rest of the Site?
Yes. Visitors who don't bounce view 2.574 pages when pricing is hidden against 4.264 when it's transparent, 65%4 more, and spend 2 minutes 31 seconds4 on-site versus 3 minutes 25 seconds4.
Is Freemium or a Free Trial Better at Producing Paying Customers?
Per 1,000 website visitors, freemium produced 905 signups and 55 paying customers; free trials produced 455 signups and 3.65 paying customers. Free trials convert signups to paid at a slightly higher rate, but the report notes that difference gets wiped out once signup rates are counted.
Should a Free Trial Ask for a Credit Card?
The modeled numbers favor it. Credit-card-required trials drew the fewest signups of the three models, 355 per 1,000 visitors, and produced the most paying customers, 10.55.
How Much Is One Point of Free-to-Paid Conversion Worth?
Roughly 15%6 more new revenue per trial for each 1-percentage-point improvement, on the same 200-product base.
So what does your closest competitor quote once the call gets real, and how far is that number from the one on their page?
We book their demo as a real prospect, sit through the pricing conversation, and write down the quote, the discount trigger, and the terms nobody puts in writing. Show us the pricing page you are up against, and we will start there.
References
- 6sense: The Point of First Contact Constant: Buyers Say, Don't Call Us, We'll Call You
- Gartner: Gartner Sales Survey Finds 67% of B2B Buyers Prefer a Rep-Free Experience
- Gartner: The B2B Buying Journey: Key Stages and How to Optimize Them
- HockeyStack Labs: The State of Pricing, Demo, and Case Study Pages
- ChartMogul (Kyle Poyar, with ProductLed): The Conversion Report: A New Look at Free-to-Paid Conversion
- ChartMogul (Kyle Poyar, with ProductLed): The Conversion Report: What's Working to Improve Free-to-Paid Conversion
.png)


