
Every SaaS company benchmarks its churn against a number it found on the internet. Almost none check whether that number covers the same period, population, or kind of churn. The benchmarks disagree with each other, and each is right about its own dataset.
Churn is also the number your competitors have rehearsed an answer for. Getting theirs means booking their demos and sitting through the sales call as a real prospect, which is the work we do for clients under a crafted fábula: a believable company profile and buying scenario.
Each number below carries a marker to the primary source it came from.
Net Revenue Retention Is Barely Clearing Break-Even
Benchmarkit and Pavilion’s 2025 B2B SaaS Performance Metrics Benchmarks put net revenue retention at 101%1. The report reads that as a warning: retaining and expanding existing customer ARR is getting harder as companies lean harder on expansion ARR.
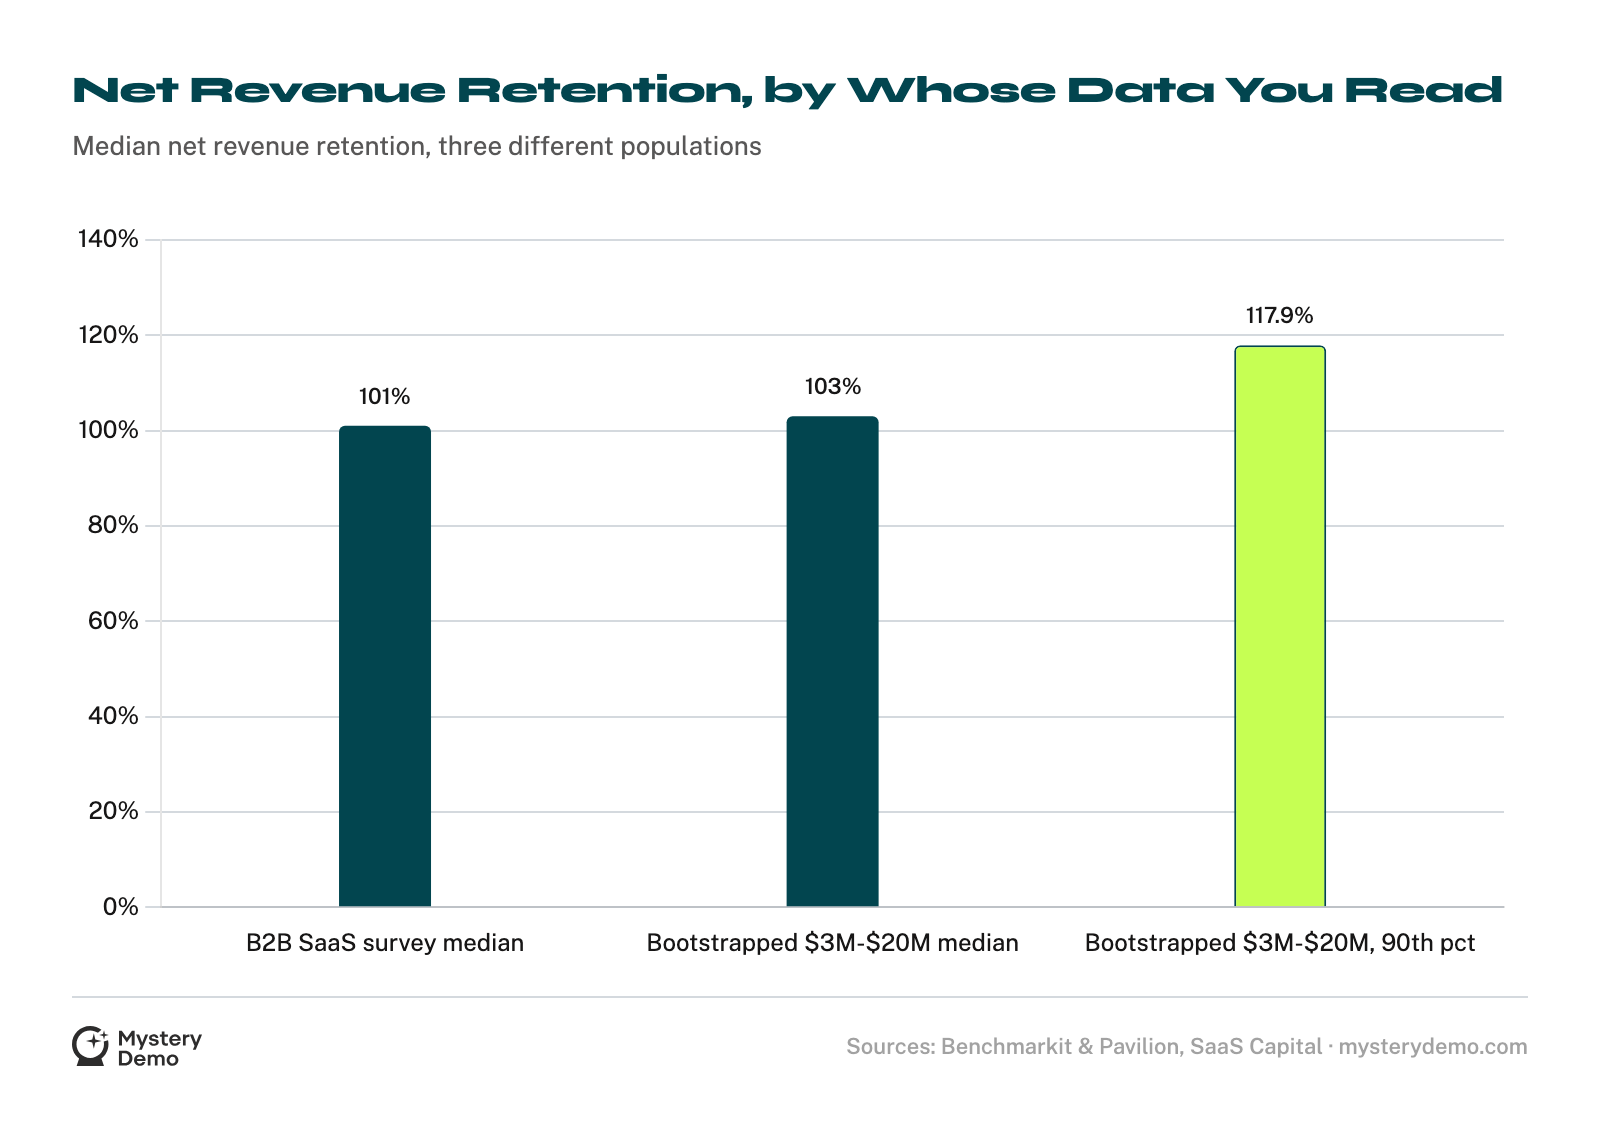
A hundred and one percent means the installed base grew by one point. That is expansion, technically.
The bootstrapped segment does better. Among bootstrapped B2B SaaS companies with $3M to $20M in ARR, median net revenue retention is 103%2, and the 90th percentile reaches 117.9%2. That top decile is a different business from the median, wearing the same category label.
The Twelve Points Between Gross And Net Are Doing The Work
Gross revenue retention is the honest number: what you keep before upsell papers over the losses.
SaaS Capital puts the average gap between gross and net revenue retention at a bit more than twelve percentage points3, so an average private B2B SaaS company at 85% GRR should expect NRR around 97%3.
Twelve points of upsell is doing a lot of load-bearing work in most board decks.
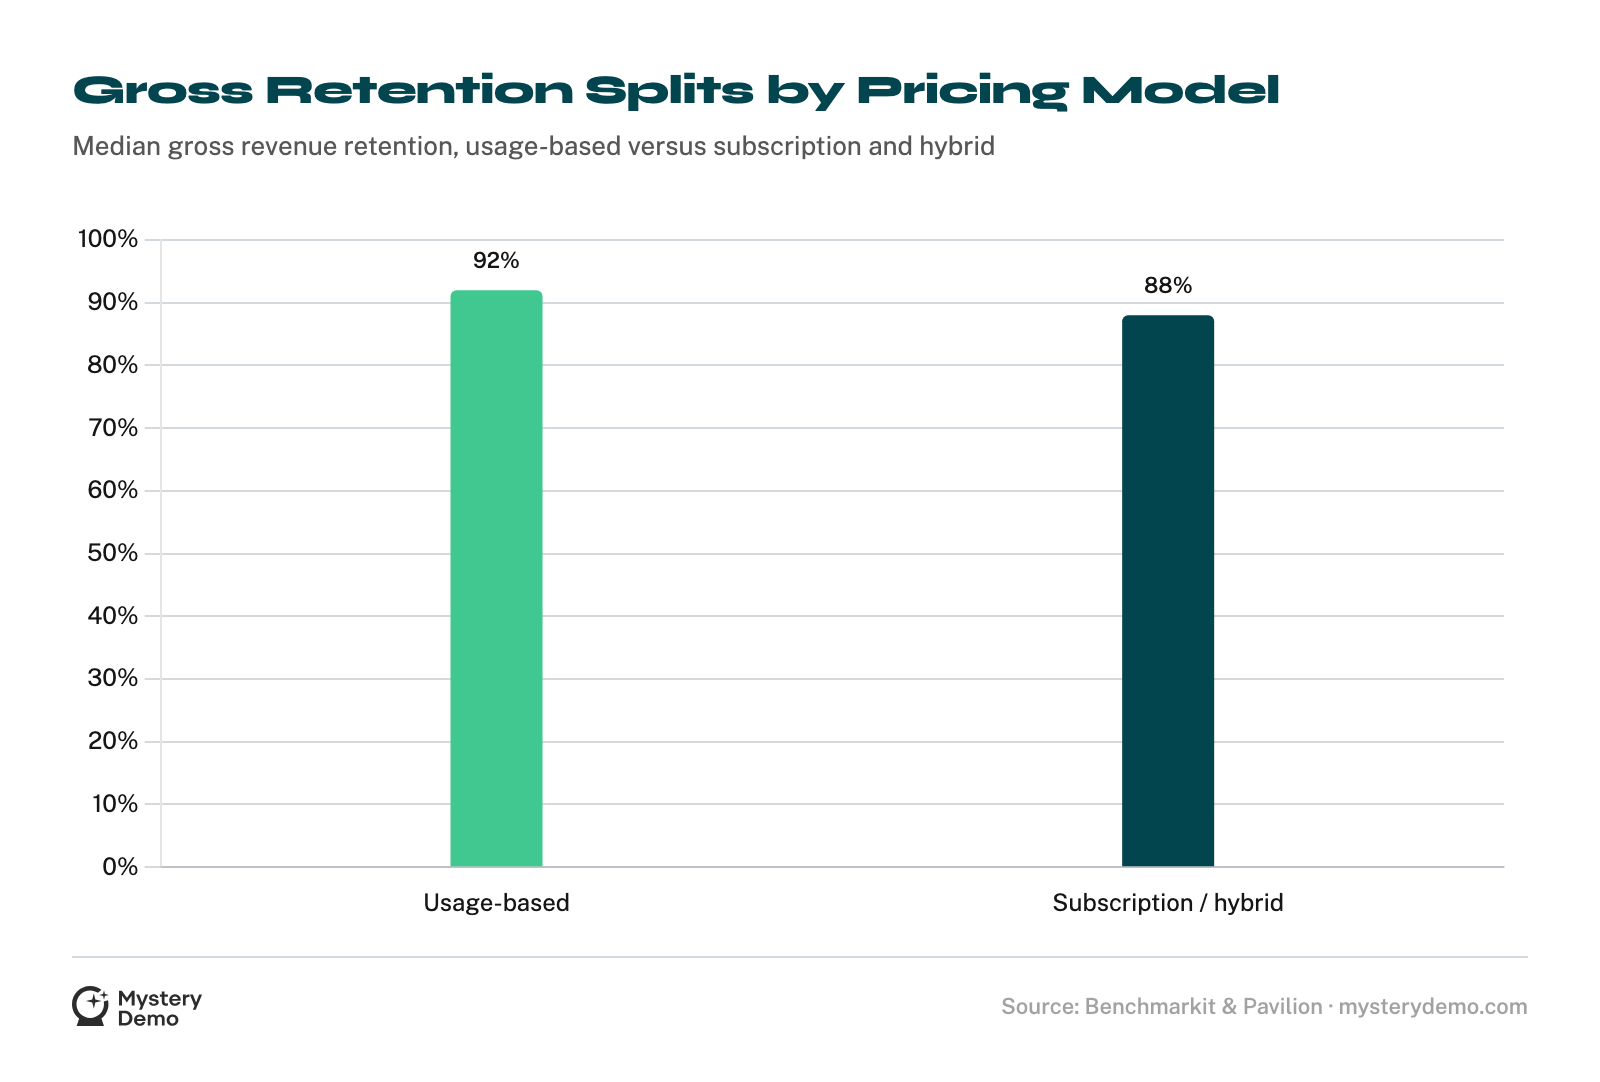
Where you sit on gross retention tracks your pricing model. In Benchmarkit and Pavilion’s 2025 survey, usage-based pricing companies posted 92% GRR1 against 88%1 for both subscription and hybrid pricing companies. It was the first year the report cut GRR that way.
Bootstrapped companies with $3M to $20M in ARR post median gross revenue retention of 91%2, with the 90th percentile at 100%2, which is a year of losing nobody.
Logo Churn Falls As The Customer Gets Bigger
ChartMogul’s SaaS metrics library reports customer churn from its own subscription dataset, and every figure in it is monthly, not annual. Read them as annual and you will conclude the industry is fine. Read them as monthly and the early-stage band is a countdown.
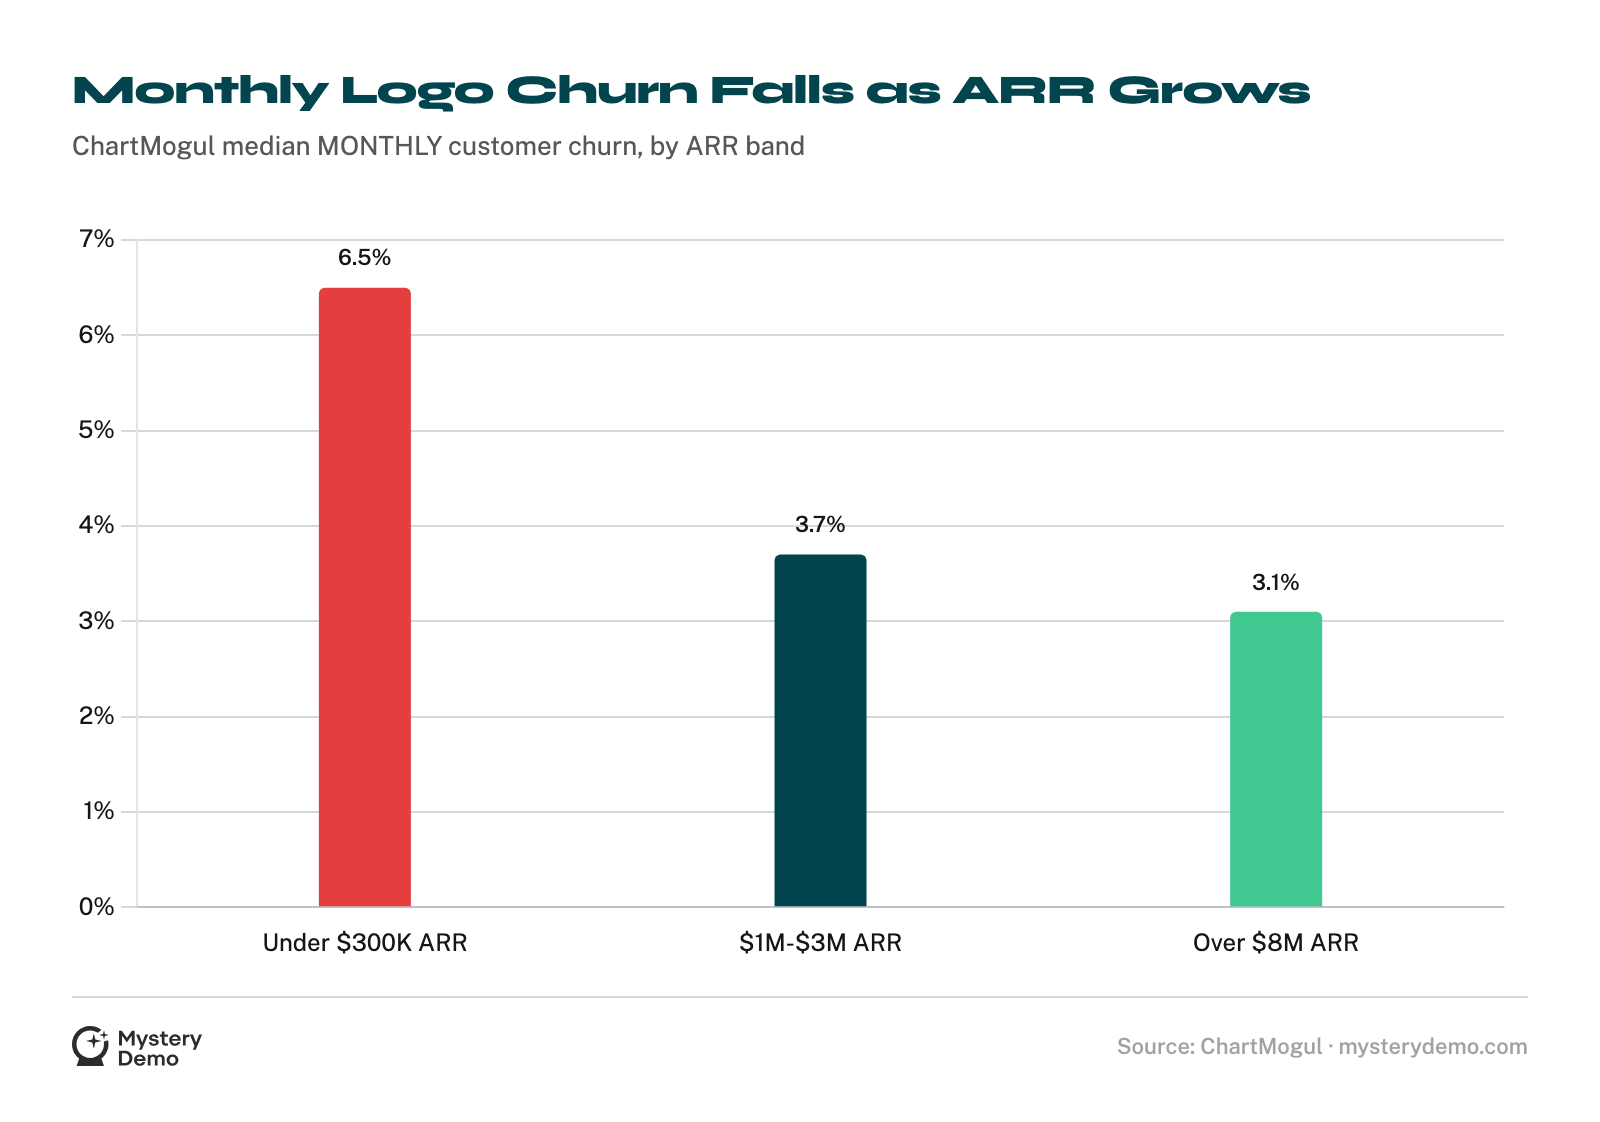
ChartMogul’s medians, by ARR band and by average revenue per account:
Small customers leave. That surprises a remarkable number of companies who priced for volume and staffed for enterprise.
Those four cuts are one vendor’s subscription dataset, not an industry consensus, and they are the only place that particular segmentation exists. Treat them as ChartMogul’s shape of the curve rather than the sector’s.

Retention Is A Growth Input, Not A Report Card
SaaS Capital’s 2025 growth rate benchmarks give retention a price. Moving net revenue retention from the 90% to 100% band into the 100% to 110% band improves growth rate by 5 percentage points6, and the highest-NRR companies report median growth 83% higher6 than the population median.
It runs the other way too. In ChartMogul’s SaaS Retention Report, companies in the low NRR band, below 60%, run a median 7% churn5, double the rate of companies at or above 100% NRR5.
Growth and retention come out of the same number. Most companies staff them as though they were two departments.
Every Churn Benchmark Is True For Someone Else
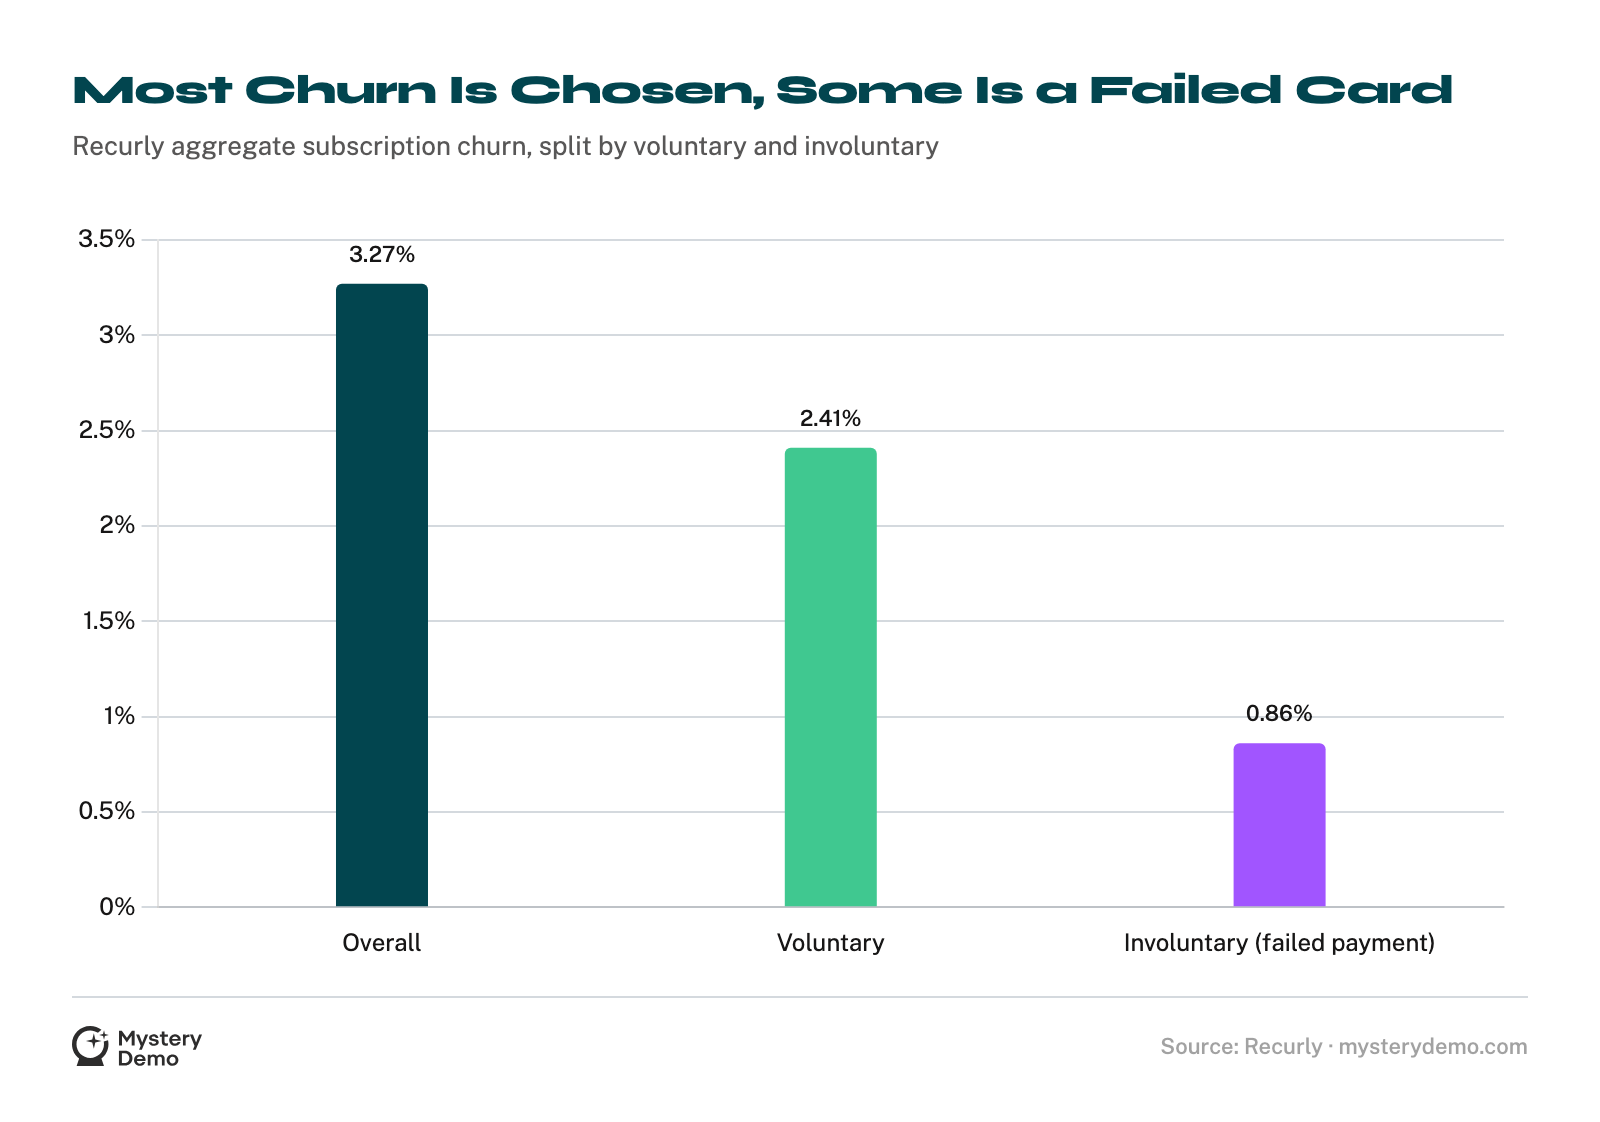
Recurly’s aggregate subscription dataset puts the overall churn rate at 3.27%7, split into 2.41 points of voluntary churn and 0.86 points of involuntary7, the failed-payment kind.
The same dataset separates B2B from consumer. Software and Business & Professional Services average 3.8%7; Digital Media & Entertainment, Consumer Goods & Retail, and Education average 6.5%7.
.png)

Then CustomerGauge, running its own research across 11 B2B industries, reports an average churn rate of 14%8 for the computer software industry. That is not a contradiction of Recurly. It is a different population, a different method, and no stated period on either.
Which is why “our churn is in line with benchmarks” is a true statement at almost any number you like.
Frequently Asked Questions
What Is A Good SaaS Churn Rate?
It depends on your size and your price point. ChartMogul’s dataset puts median monthly customer churn at 6.5%4 for companies under $300K ARR and 3.1%4 for companies over $8M ARR. A number with no ARR band and no period attached is not a benchmark.
Is SaaS Churn Measured Monthly Or Annually?
Both, and the source has to say which. ChartMogul’s customer churn figures are explicitly monthly4. Recurly reports an overall churn rate of 3.27%7 without stating a period, so it cannot be set against a monthly figure directly.
What Is A Good Net Revenue Retention Rate?
Benchmarkit and Pavilion put net revenue retention at 101%1 across their 2025 B2B SaaS survey. Bootstrapped companies with $3M to $20M in ARR run a median of 103%2, with the 90th percentile at 117.9%2.
Why Is Gross Revenue Retention Always Lower Than Net?
Gross retention counts only what you lose. Net retention adds upsell and cross-sell back in. SaaS Capital measures the average gap at a bit more than twelve percentage points3 across private B2B SaaS companies, so an 85% GRR business should expect roughly 97% NRR3.
Does Pricing Model Affect Retention?
In Benchmarkit and Pavilion’s 2025 survey it did. Usage-based pricing companies posted 92% GRR1 against 88%1 for both subscription and hybrid pricing companies. It was the first year the report cut GRR that way.
Does Churn Fall As Deal Size Grows?
In ChartMogul’s dataset it does. Median monthly customer churn runs 6.1%4 for companies with ARPA under $25 per month and 2.2%4 once ARPA passes $500 per month.
Do B2B SaaS Companies Churn Less Than Consumer Subscriptions?
In Recurly’s dataset, yes. Software and Business & Professional Services average 3.8%7 churn, against 6.5%7 for Digital Media & Entertainment, Consumer Goods & Retail, and Education.
What Is Involuntary Churn?
Customers who leave because a payment failed rather than because they decided to go. Recurly splits its 3.27%7 overall churn rate into 2.41 points voluntary and 0.86 points involuntary7.
How Much Growth Does Better Retention Buy?
SaaS Capital measured it. Moving net revenue retention from the 90% to 100% band into the 100% to 110% band improves growth rate by 5 percentage points6, and the highest-NRR companies report median growth 83% higher6 than the population median.
What Churn Rate Does The Software Industry Report?
CustomerGauge’s research across 11 B2B industries reports an average churn rate of 14%8 for computer software. That is a different population and method from Recurly’s 3.27%7, and neither states a period, so the two do not compare.
Does High Churn Show Up In Net Revenue Retention?
It does. ChartMogul found companies in the low NRR band, below 60%, running a median 7% churn5, double the rate of companies at or above 100% NRR5.
A benchmark tells you the shape of a distribution. It does not tell you what your competitor’s rep says when a prospect asks about churn, or what they put on the table to keep a deal from dying.
We can get you that: the churn number the rep quotes and will not define, the contract term that appears once the deal is real, the save offer that lands the moment you mention leaving. We book the demos and sit the calls for you.
Watch us try to cancel a competitor’s subscription, and tell us whose to start with.
References
- Benchmarkit & Pavilion: 2025 B2B SaaS Performance Metrics Benchmarks
- SaaS Capital: 2026 Benchmarking Metrics for Bootstrapped SaaS Companies
- SaaS Capital: Examining the Gap Between Gross Revenue Retention and Net Revenue Retention
- ChartMogul: Customer Churn Rate (SaaS Metrics Library)
- ChartMogul: The SaaS Retention Report, The New Normal For SaaS
- SaaS Capital: 2025 Private B2B SaaS Company Growth Rate Benchmarks
- Recurly: Churn Rate Benchmarks by Industry
- CustomerGauge: Average Churn Rate by Industry (State of B2B Account Experience report)
.png)


