
A sales engineer is usually shared between several sellers. In Navattic’s survey of 70+ sales engineers and presales professionals at B2B SaaS companies, taken in December 2025 and January 2026, the most common ratio was 3:1, three account executives to one engineer,1 and most organizations had each engineer support two to five.1 Those engineers ran an average of 7 demos a week,1 and a standard demo took 3.6 hours of their time, prep included.1
The figures below cover how many sellers one engineer supports, how long demos take, how much of the week goes to selling, what engineers are measured on, and how far AI has reached the work. They come from four reports published in 2025 and 2026. Three are by companies that sell demo or RFP software (Navattic, Consensus and Loopio) and one is by the North American Association of Sales Engineers (NAASE), so every figure keeps its population beside it.
Mystery Demo takes software companies’ real sales demos as a buyer and brings back what was said, shown and quoted, from the first call to the technical deep dive. It meets demos like the ones these engineers describe from the buyer’s side of the table.
Key Takeaways
One Sales Engineer Usually Supports Several Account Executives
If you run sales or enablement, the engineer your sellers bring to a demo is usually shared, so how that engineer’s hours get split is a team decision. Three surveys asked how many account executives one engineer supports, and each reported the answer in its own categories.
| Survey | Who answered | What it found |
|---|---|---|
| Navattic, 2026 | 70+ presales professionals at B2B SaaS companies | 3:1 most common; most between 2 and 51 |
| Consensus, 2026 | 423 presales professionals | 3:1 to 5:1 for roughly 40%2 |
| NAASE, Signals 2025 | 42 sales engineers who chose to answer | 2 to 3 most common, at 31%3 |
NAASE’s full spread shows how far apart teams sit. Of its 42 respondents, 31% supported two to three account executives, 24% supported four to six and 17% supported seven or more,3 while 17% said it varies, 7% were not sure and 5% supported just one.3
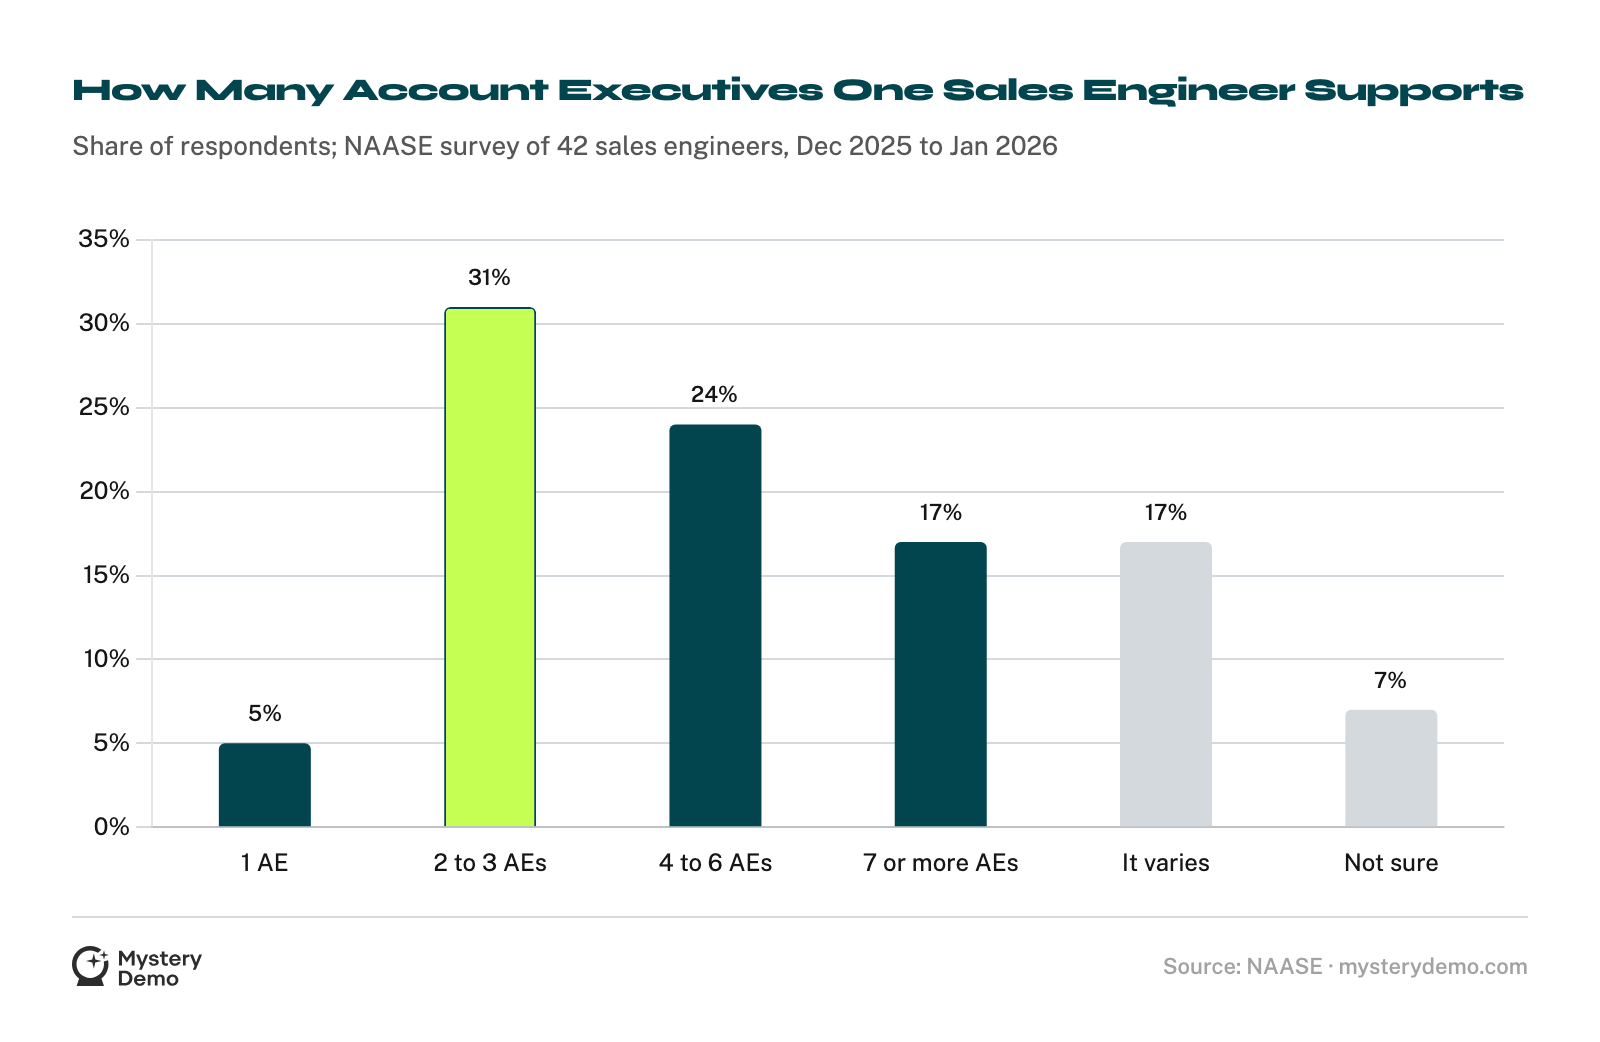
NAASE also split one answer by ratio, inside that small sample. Among engineers supporting one to three account executives, 40% named their alignment with the account executives as a leading challenge, against 17% of those supporting four or more.3 Their demos draw on the engineer’s time, so the next question is what one demo costs.
A Standard Demo Takes Hours, Prep Included
For the team booking demos, the engineer’s time on a demo includes the preparation before it, not only the call. Navattic’s respondents averaged 7 demos a week, with 3 to 5 the most common range.1 As Navattic published them, closing a deal took an average of 3 demos, while the most common range was 4 to 5.1
Two surveys timed the work around a single demo, and they timed different things. Consensus counted “staff hours” without saying whose.
| Survey | What was timed | Finding |
|---|---|---|
| Navattic | A standard demo, prep included | 3.6 hours on average1 |
| Navattic | A custom demo, prep included | 7 hours on average1 |
| Consensus | Prep and follow-up, staff hours | 28% spent 6 hours or more2 |
| Consensus | Prep and follow-up, staff hours | 15% spent 11 or more, within the 28%2 |
Repeating the same demo is common. In Navattic’s survey, 94% ran repetitive demos at least sometimes,1 34% ran them often,1 and 34% said their standard demo had little to no customization.1 Consensus measured how standardized demos are: 28% of its respondents said their demos were only 0 to 25% standardized,2 and 38% said 30 to 50%.2
Navattic also measured what surrounds the demo:
Many demos reach buyers who were not qualified for them:
Demos are only part of the job, and Consensus also put a number on the rest of the week.
Selling Takes Little More Than Half an Engineer’s Time
For a sales leader, the engineer borrowed for a demo is also doing other teams’ work, out of the same week. Consensus’s respondents spent 56% of their time on direct sales activities: active sales cycles, demos, discovery and proofs of concept.2 The report names three parts of the other 44%: implementation or customer success support at 14%, marketing at 11% and product development collaboration at 9%.2
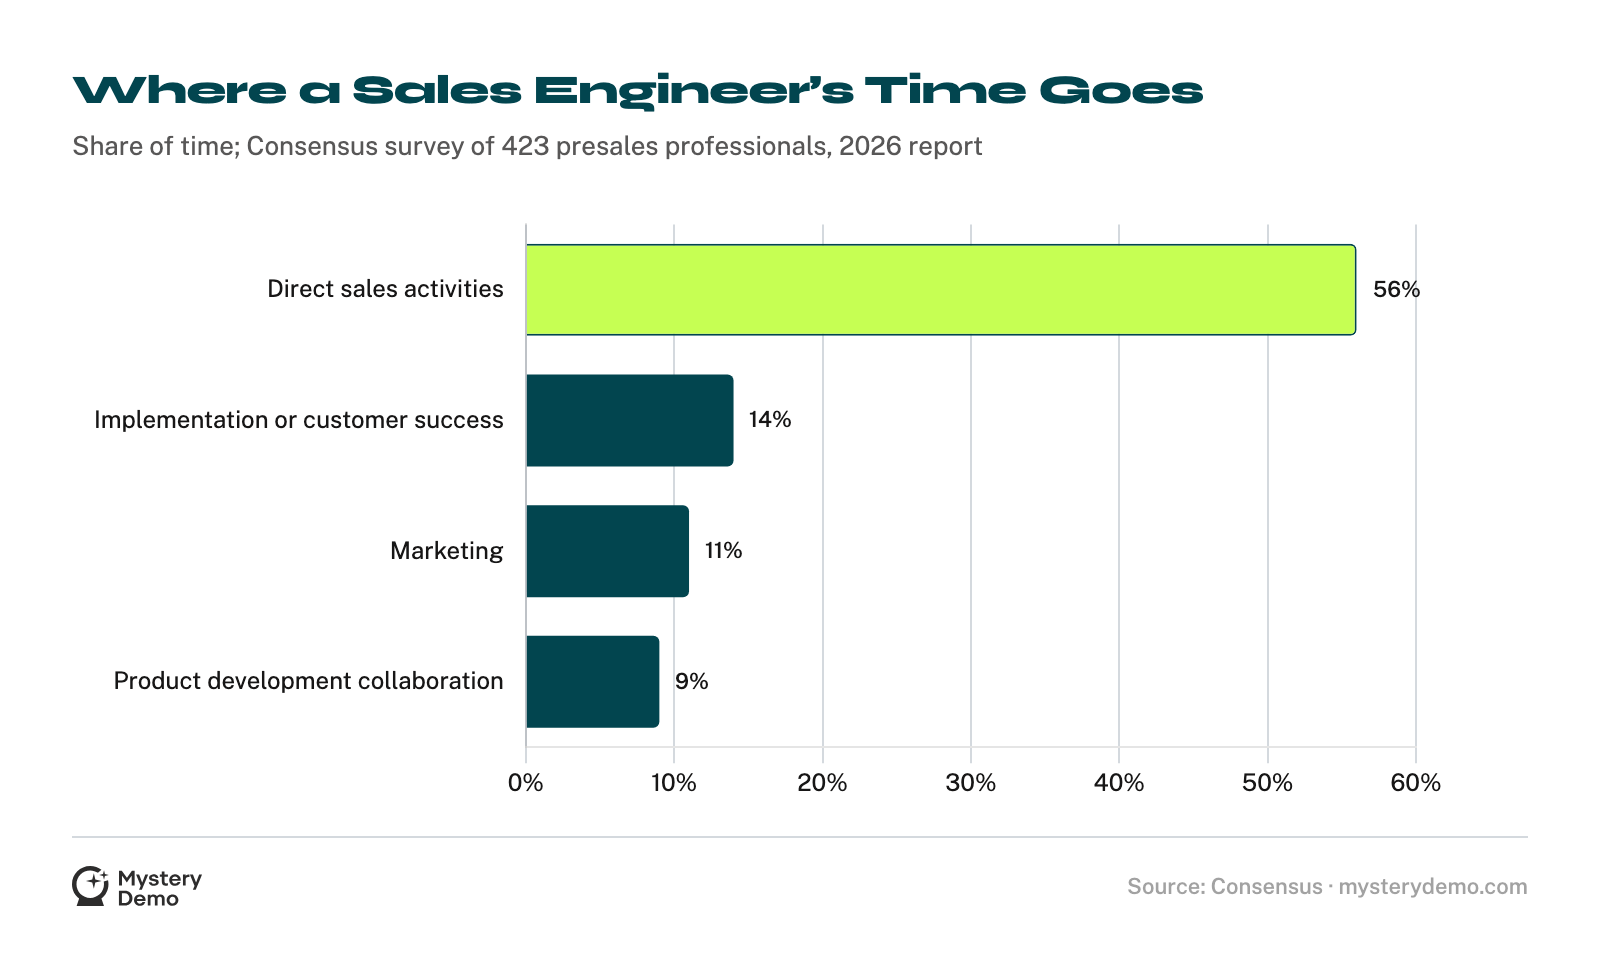
NAASE asked a different question, which responsibilities sit in the role at all, and also found a broad role among its 42 respondents.
Consensus also tracks burnout from year to year. Its 2026 report puts the share of engineers with no burnout symptoms at 12%, against 20% in its 2025 report.2
RFPs Are Timed in a Different Population
RFP work is measured among the people involved in responding to RFPs. Loopio’s 2025 report surveyed 1,544 of them, from proposal managers to sales engineers, and its figures describe 2024. Those teams spent 25 hours writing each RFP, down from 30 the year before.4
The drop was not shared by every role. Proposal teams cut their writing time per RFP from 34 hours to 24,4 while respondents in sales operations, enablement or presales roles went from 25 hours to 28.4

Engineers themselves ranked RFPs low among their troubles: 12% of NAASE’s respondents named security reviews, compliance or RFPs among their biggest challenges.3 None of these surveys says how much of a sales engineer’s own week goes to RFPs. The surveys count the hours, and what those hours do to deals is the harder question.
The Surveys Do Not Isolate What Engineers Do to Win Rates
For a revenue leader, the surveys show how engineers describe their value and how they are measured, not what their work changes. NAASE and Consensus asked about value and measurement in different ways.
| Survey | Question | Answers |
|---|---|---|
| NAASE, 42 engineers | Where they add the most measurable value (shares total 185%) | Win rate, 52%;3 strategic account influence, 38%3 |
| NAASE, 42 engineers | The main factor in their reviews or pay | A mix of metrics, 50%;3 revenue influenced, 29%;3 win rate, 5%3 |
| Consensus, 423 people | How presales is measured | Closed revenue or ARR, 78%;2 demo or POC activity, 54%2 |
| Consensus, 423 people | Who carries the quota | The team, nearly 58%;2 the individual, 23%2 |
Many of NAASE’s engineers listed the win rate among the places they add value, and few named it as the main factor in their reviews. The value shares add up to 185%, so respondents picked several areas, while the review shares add up to about 100%, so they picked one. In Consensus’s survey, closed revenue was the most common measure, and more respondents said their team carries a quota than said they carry their own.
The win rates that were measured do not measure what engineers contribute:
Navattic does not say how many deals or customers its CRM data covers or how long the deals were observed, and a link between demos sent and deals won is a correlation, not a measure of what engineers do. NAASE cites a 2015 McKinsey article that associates strong presales capabilities with higher win rates, an association rather than an isolated effect. The surveys do show how engineers are changing their own work, starting with AI.
AI Use Is Common, and Most Reported Gains Are Modest
For an enablement team, AI is already part of most engineers’ work, and in the largest survey most respondents called the gain slight or moderate. Three surveys measured AI in different populations.
| Survey | Measure | Finding |
|---|---|---|
| NAASE, 42 engineers | Use AI tools regularly | 59%3 |
| NAASE, 42 engineers | Have clear, consistent AI rules | 22%3 |
| Consensus, 423 respondents | Report some productivity gain from AI | 88%2 |
| Consensus, 423 respondents | Call their gains slight or moderate | Nearly 73% of all2 |
| Consensus, 423 respondents | No automation in the demo process | 32% of teams2 |
| Loopio, 2024 data | Used AI for RFPs in the past year | 68%4 |
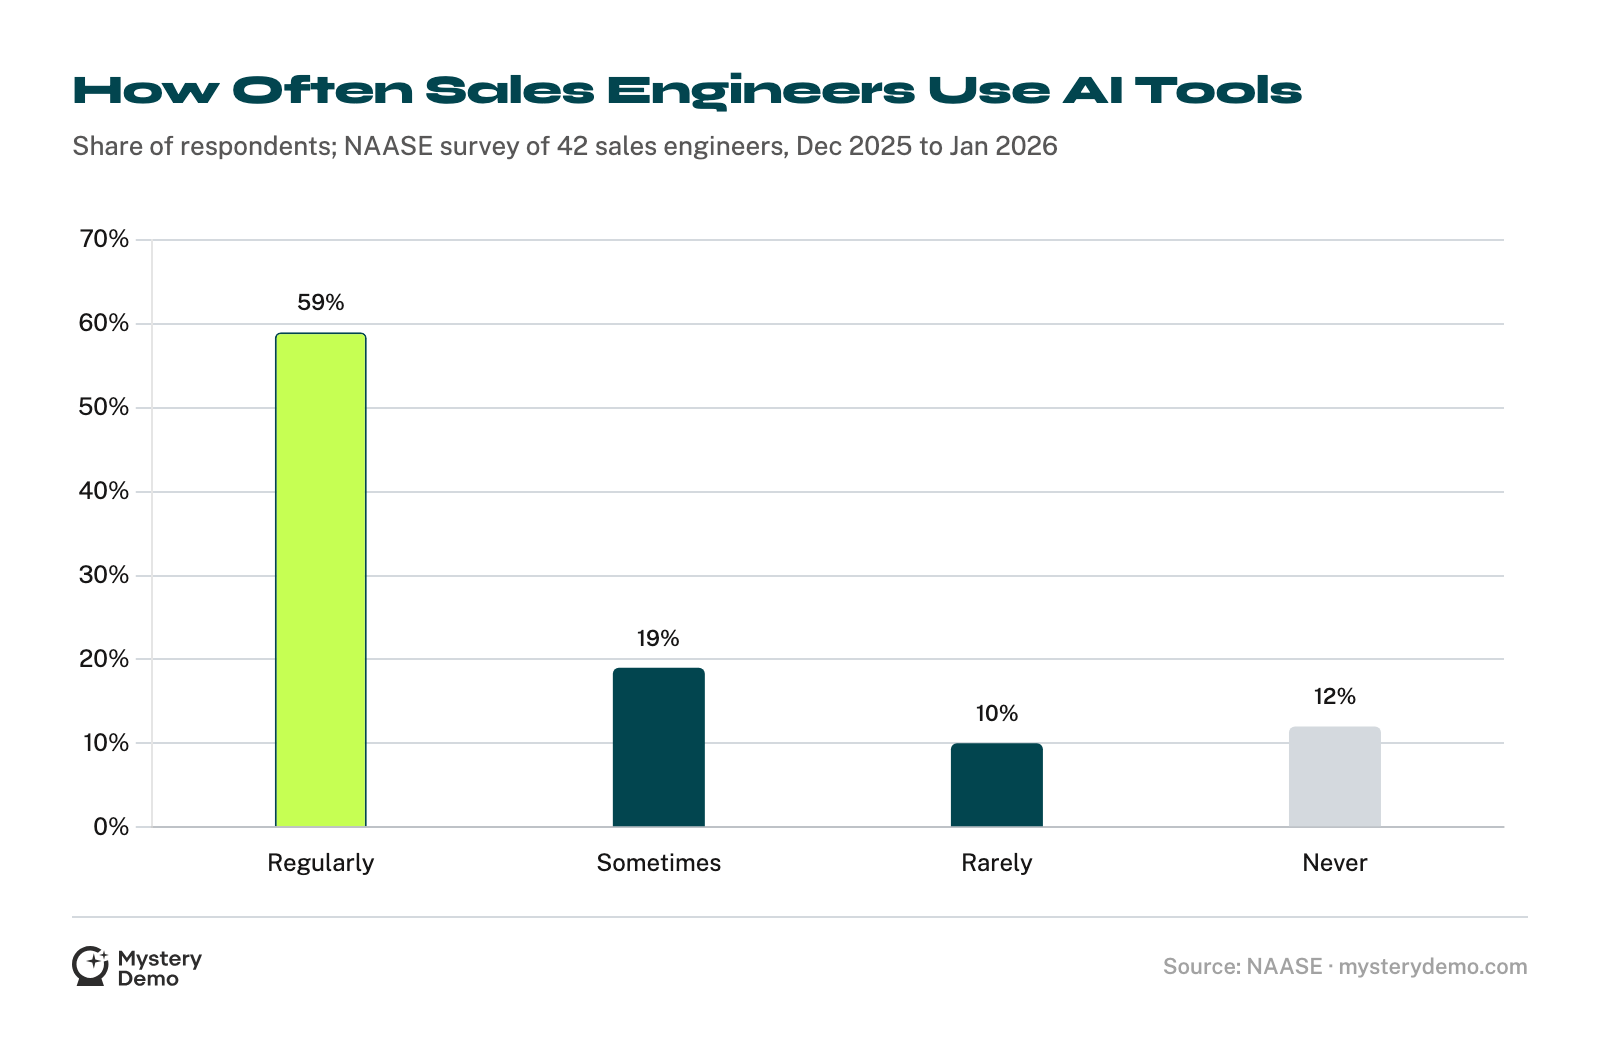
Of Consensus’s respondents, nearly 73% called their gains slight or moderate2 and 15% significant or transformational.2 NAASE reads its own numbers as use moving faster than company rules: 45% said their AI guidelines exist but are still evolving,3 26% called them unclear or inconsistent,3 and 22% said their company provides approved or private AI tools.3
Regular use differed by industry, in two small groups within NAASE’s 42: 75% among software and IT engineers and 50% elsewhere.3 Among Loopio’s RFP teams in 2024, 70% of those using AI used it at least weekly.4
Consensus, which sells demo automation, suggests AI is often layered onto manual workflows rather than built into how demos are delivered.2 It found that 64% of teams did not use what it calls intelligent demo automation.2 None of the survey questions asks what AI demo tools do to win rates or to the hours a demo takes, and the vendor figures that come near it describe the vendors’ own customers.


What a Rival’s Sales Engineer Shows Your Buyer
The figures above are survey shares and averages, most of them practitioners reporting on their own work. None of them says what one rival’s engineer shows a buyer in the technical deep dive, what they promise is coming, or which question they take offline. That happens on a call, with a buyer in the room.
Mystery Demo reaches that call the way a serious prospect would:
Below is that scorecard on our public example board, where the client and all five competitors are invented. Every real board is built from the calls with that client’s own competitors.
Each row is a rival and each column a step the buyer went through: how fast they answered, how good the demo was, how transparent they were, and how they followed up. The notes in the demo column say who ran each demo and how, which is the part no survey of engineers reports about a rival.
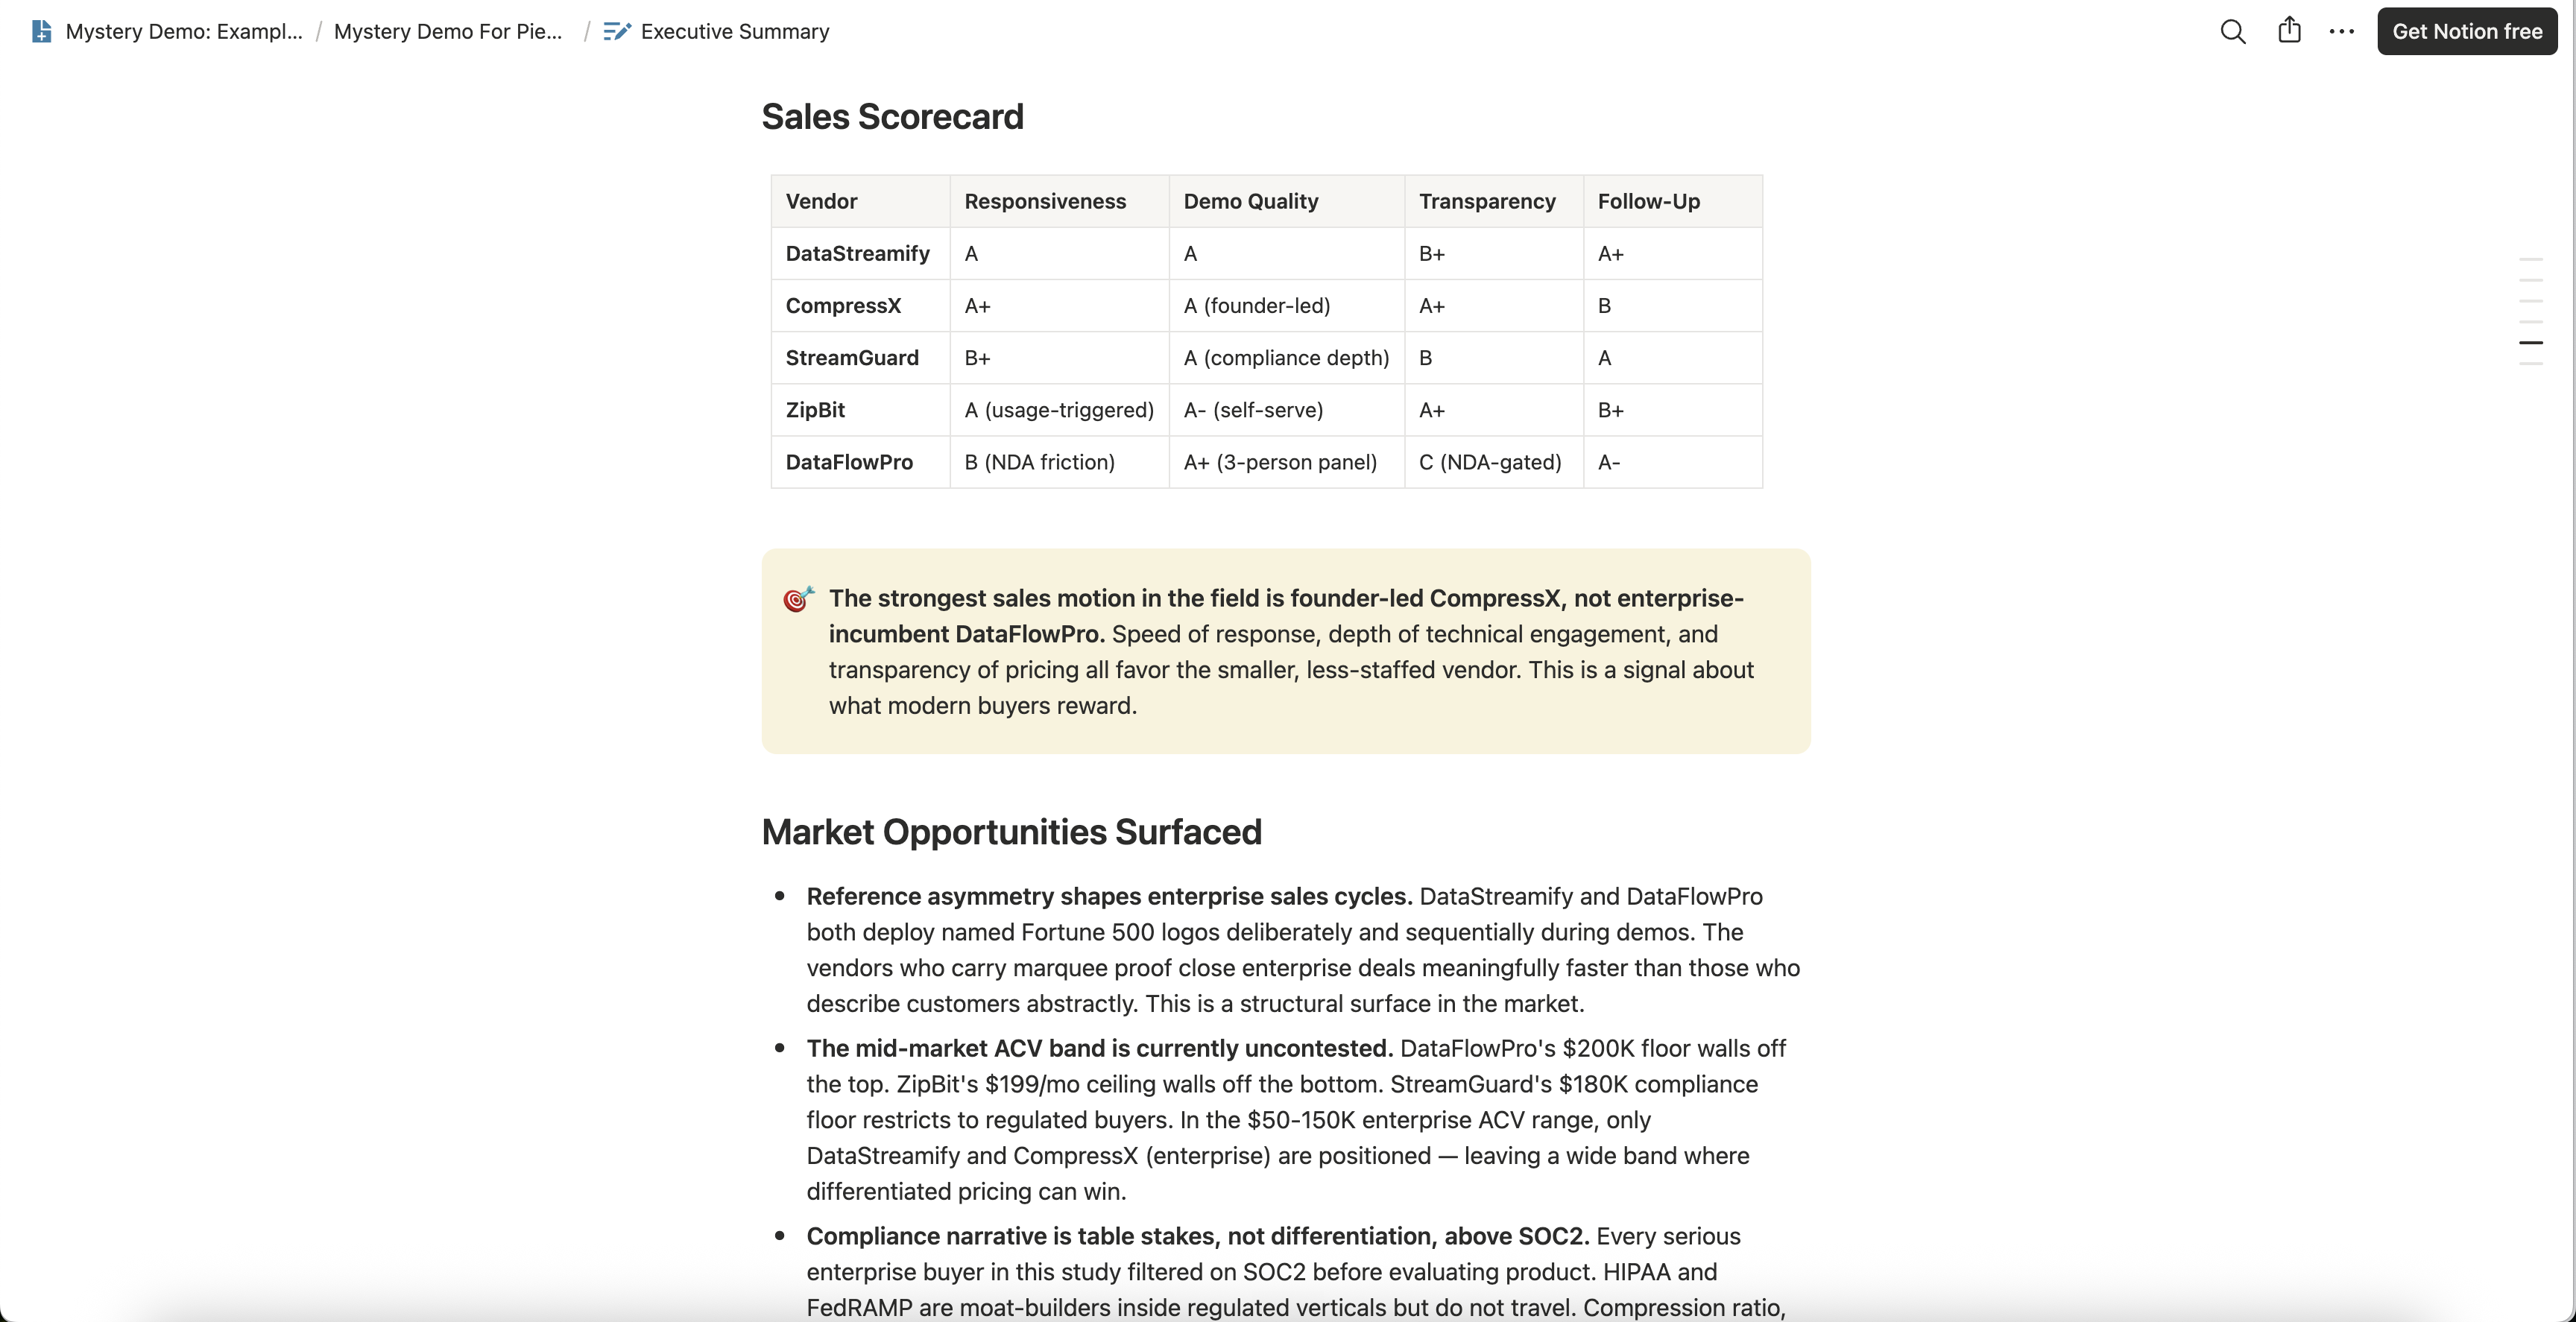
Pick the rival whose engineer your buyers meet most often. After a short intro call to plan that buyer, we take the rival’s demo and deep dive as the buyer, and the recordings come back with that rival’s row of the scorecard filled in, for a flat €499 per competitor.
Frequently Asked Questions
What Is the Typical Sales Engineer to Account Executive Ratio?
3:1 was the most common ratio in Navattic’s survey of 70+ presales professionals, with most organizations at two to five account executives per engineer.1 Roughly 40% of Consensus’s 423 presales professionals worked at 3:1 to 5:1,2 and NAASE’s most common answer was two to three account executives, at 31%.3
How Many Demos Does a Sales Engineer Run per Week?
7 demos a week on average in Navattic’s survey, with 3 to 5 the most common range.1
How Long Does It Take to Prepare and Deliver a Sales Demo?
3.6 hours for a standard demo including prep, and 7 hours for a custom one, in Navattic’s survey.1 In Consensus’s survey, 28% spent six or more staff hours preparing and following up on a single demo.2
How Much of a Sales Engineer’s Time Goes to Selling?
56% of their time went to direct sales activities, in Consensus’s survey of 423 presales professionals.2
How Long Does It Take to Write an RFP?
25 hours of writing per RFP in Loopio’s 2025 report, which describes 2024, down from 30,4 and 28 hours for respondents in sales operations, enablement or presales roles.4
Do Sales Engineers Use AI?
59% of the 42 engineers in NAASE’s survey used AI tools regularly.3 In Consensus’s survey, 88% reported some productivity gain from AI, and nearly 73% of all respondents called their gains slight or moderate.2
How Are Sales Engineers Measured?
78% of Consensus’s respondents named closed revenue or ARR as a measure of presales performance, the most common one.2 Among NAASE’s 42 respondents, half said their reviews or pay turned on a mix of metrics.3


